- Sub Categories
-
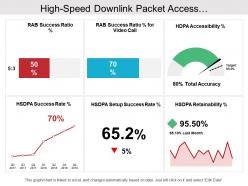 High speed downlink packet access telecommunications dashboard
Presenting this set of slides with name - High Speed Downlink Packet Access Telecommunications Dashboard. Innovative PowerPoint slide as it is accessible with different nodes and stages. Presentation template can display in standard and widescreen view. Amendable PPT design as color, text and shape can be edited. Downloading is rapid and easy to share even with large audience. PowerPoint graphic works well with Google slide. Variable design can be changed into JPEG and PDF document. Preference to amend and add business details at any stage before delivering.
-
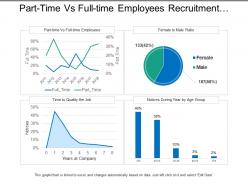 Part time vs full time employees recruitment dashboard
Presenting this set of slides with name - Part Time Vs Full Time Employees Recruitment Dashboard. This is a four stage process. The stages in this process are Staffing Plan, Recruitment, Staff Management.
-
 Customer service dials per hour and call success rate dashboard
Presenting customer service dials per hour and call success rate dashboard presentation slide. Well-crafted graphics has been used in this template. This template is entirely adjustable with Google Slide. Have the tendency to increase the overall influence of your presentation. Quick to download and presented to be saved in JPEG, JPG or PDF format if required. You can personalize the template slide by adding your company information when required. Educational slides are available for guidance. This slide maintains the professionalism of the presentation. Graphics quality does not blur when projected on large screen.
-
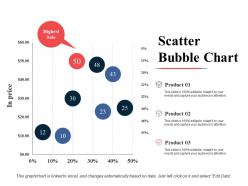 Scatter bubble chart finance ppt powerpoint presentation file graphics
This is a three stages process. The stages in this process are Finance, Marketing, Management, Investment, Analysis.
-
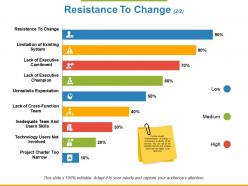 Resistance to change lack of existing commitmen ppt powerpoint presentation file background
This is a nine stages process. The stages in this process are Finance, Marketing, Management, Investment, Analysis.
-
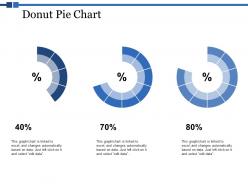 Donut pie chart ppt powerpoint presentation portfolio
This is a three stages process. The stages in this process are Finance, Marketing, Management, Investment, Analysis.
-
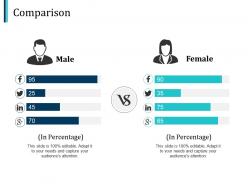 Comparison male female ppt pictures design templates
This is a two stage process. The stages in this process are Finance, Analysis, Business, Investment, Marketing.
-
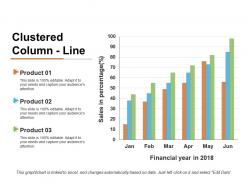 Clustered column - line ppt summary example topics
This is a three stage process. The stage in this process are Business, Management, Marketing, Sales, Financial.
-
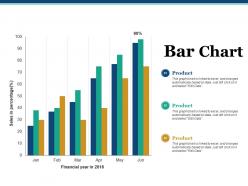 Bar chart ppt visual aids infographic template
This is a three stage process. The stages in this process are Product, Percentage, Business, Management, Marketing.
-
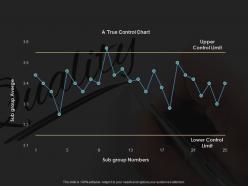 Control charts ppt styles infographic template
This is a two stage process. The stages in this process are Management, Marketing, Business, Percentage, Product.
-
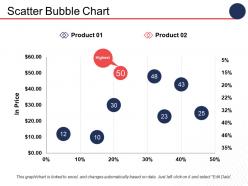 Scatter bubble chart finance ppt infographics infographic template
This is a two stage process. The stages in this process are Finance, Marketing, Analysis, Business, Investment.
-
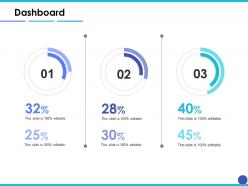 Dashboard Snapshot ppt inspiration example introduction
This is a three stage process. The stages in this process are Finance, Analysis, Business, Investment, Marketing.
-
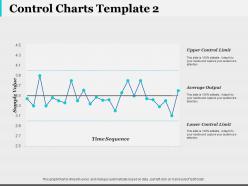 Control charts finance ppt infographic template infographic template
This is a three stage process. The stages in this process are Finance, Analysis, Business, Investment, Marketing.
-
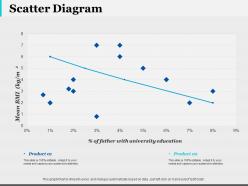 Scatter investment ppt infographic template
This is a two stage process. The stages in this process are Finance, Analysis, Business, Investment, Marketing.
-
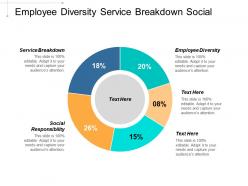 Employee diversity service breakdown social responsibility internet business communication cpb
This is an editable five stages graphic that deals with topics like Employee Diversity, Service Breakdown, Social Responsibility, Internet Business Communication to help convey your message better graphically. This product is a premium product available for immediate download, and is 100 percent editable in Powerpoint. Download this now and use it in your presentations to impress your audience.
-
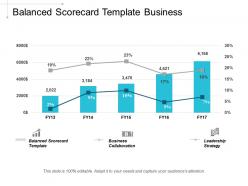 Balanced scorecard template business collaboration leadership strategy learning curve cpb
This is an editable five stages graphic that deals with topics like Balanced Scorecard Template, Business Collaboration, Leadership Strategy, Learning Curve to help convey your message better graphically. This product is a premium product available for immediate download, and is 100 percent editable in Powerpoint. Download this now and use it in your presentations to impress your audience.
-
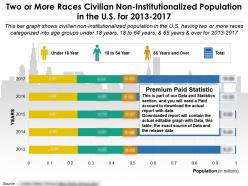 Two or more races civilian non institutionalized population in the us for 2013-2017
Presenting this set of slides with name - Two Or More Races Civilian Non Institutionalized Population In The Us For 2013-2017. Two or more races civilian non institutionalized population in the U.S. for 2013 to 2017. This is part of our Data and Statistics products selection, and you will need a Paid account to download the actual report with accurate data. Downloaded report will contain the actual editable graph with the actual data, an excel table with the actual data, the exact source of the data and the release date. This bar graph shows civilian non institutionalized population in the U.S. having two or more races categorized into age groups under 18 years, 18 to 64 years, and 65 years and over for 2013 to 2017. It covers topic Two or more races population for region USA and is for date range 2013 to 2017. Download it immediately and use it for your business.
-
 Market categories functional process 360 degree evaluations tool cpb
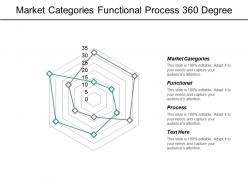
Presenting this set of slides with name - Market Categories Functional Process 360 Degree Evaluations Tool Cpb. This is an editable four stages graphic that deals with topics like Market Categories, Functional, Process, 360 Degree Evaluations Tool to help convey your message better graphically. This product is a premium product available for immediate download, and is 100 percent editable in Powerpoint. Download this now and use it in your presentations to impress your audience.
-
 Total population of households categories in past 12 months in 2017 inflation adjusted dollars from year 2013-22
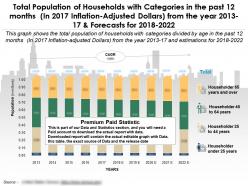
Presenting this set of slides with name - Total Population Of Households Categories In Past 12 Months In 2017 Inflation Adjusted Dollars From Year 2013-22. Total Population Of Households With Categories In The Past 12 Months In 2017 Inflation Adjusted Dollars From The Year 2013 to 17 And Forecasts For 2018 to 2022. This is part of our Data and Statistics products selection, and you will need a Paid account to download the actual report with accurate data. Downloaded report will contain the actual editable graph with the actual data, an excel table with the actual data, the exact source of the data and the release date. This Graph Shows The Total Population Of Households With Categories Divided By Age In The Past 12 Months In 2017 Inflation Adjusted Dollars From The Year 2013 to 17 And Estimations For 2018 to 2022. It covers topic Households Population with Categories by Age for region USA and is for date range 2013 to 2022. Download it immediately and use it for your business.
-
 Total civilian employed population 16 years and over by male and female with occupations in us for 2017
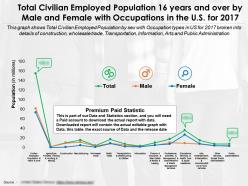
Presenting this set of slides with name - Total Civilian Employed Population 16 Years And Over By Male And Female With Occupations In Us For 2017. Total Civilian Employed Population 16 years and over by Male and Female with Occupations in the U.S. for 2017. This is part of our Data and Statistics products selection, and you will need a Paid account to download the actual report with accurate data. Downloaded report will contain the actual editable graph with the actual data, an excel table with the actual data, the exact source of the data and the release date. This graph shows Total Civilian Employed Population by sex with Occupation types in US for 2017 broken into details of construction, wholesale trade, Transportation, Information, Arts and Public Administration. It covers topic Occupation Types for Civilian Employed Population for region USA and is for date range 2017. Download it immediately and use it for your business.
-
 Pie chart finance marketing management investment analysis
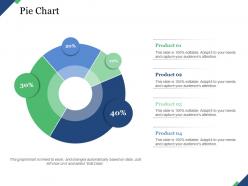
Presenting this set of slides with name - Pie Chart Finance Marketing Management Investment Analysis. This is a four stage process. The stages in this process are Post It, Notes, Marketing, Business, Management.
-
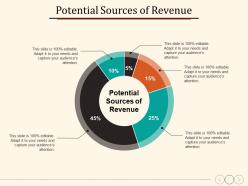 Potential sources of revenue planning strategy marketing
Presenting this set of slides with name - Potential Sources Of Revenue Planning Strategy Marketing. This is a five stage process. The stages in this process are Finance, Marketing, Management, Investment, Analysis.
-
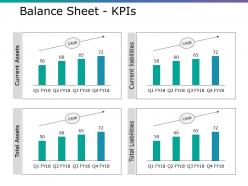 Balance sheet kpis ppt show diagrams
Presenting this set of slides with name - Balance Sheet Kpis Ppt Show Diagrams. This is a four stage process. The stages in this process are Current Assets, Total Assets, Current Liabilities, Total Liabilities.
-
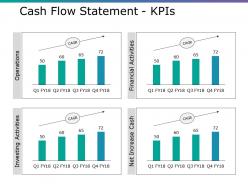 Cash flow statement kpis ppt file outfit
Presenting this set of slides with name - Cash Flow Statement Kpis Ppt File Outfit. This is a four stage process. The stages in this process are Operations, Financial Activities, Net Increase Cash, Investing Activities.
-
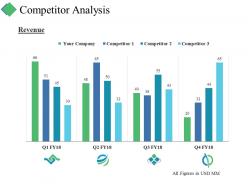 Competitor analysis ppt summary visuals
Presenting this set of slides with name - Competitor Analysis Ppt Summary Visuals. This is a four stage process. The stages in this process are Business, Marketing, Analysis, Strategy, Revenue.
-
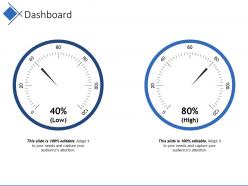 Dashboard snapshot powerpoint show
Presenting this set of slides with name - Dashboard Snapshot Powerpoint Show. This is a two stage process. The stages in this process are Business, Marketing, Dashboard, Percentage, Process.
-
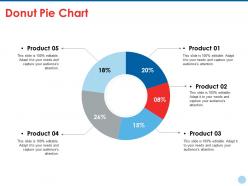 Donut pie chart ppt styles layout ideas
Presenting this set of slides with name - Donut Pie Chart Ppt Styles Layout Ideas. This is a five stage process. The stages in this process are Business, Marketing, Chart, Percentage, Process.
-
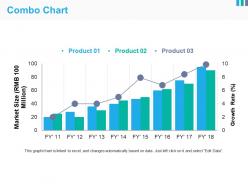 Combo chart powerpoint slide themes
Presenting this set of slides with name - Combo Chart Powerpoint Slide Themes. This is a three stage process. The stages in this process are Combo Chart, Finance, Analysis, Marketing, Strategy.
-
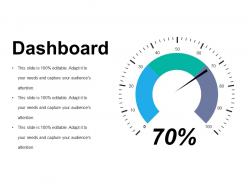 Dashboard powerpoint slide design templates
Presenting this set of slides with name - Dashboard Powerpoint Slide Design Templates. This is a one stage process. The stages in this process are Dashboard, Marketing, Measurement, Strategy, Business.
-
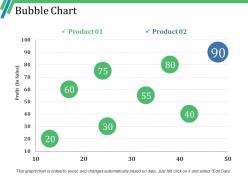 Bubble chart example of ppt presentation
Presenting this set of slides with name - Bubble Chart Example Of Ppt Presentation. This is a two stage process. The stages in this process are Business, Marketing, Finance, Bubble Chart, Profit.
-
 Combo chart presentation layouts
Presenting this set of slides with name - Combo Chart Presentation Layouts. This is a three stage process. The stages in this process are Business, Marketing, Graph, Growth Rate, Market Size.
-
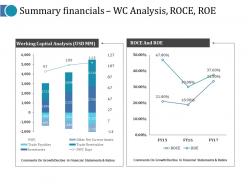 Summary financials wc analysis roce roe ppt model smartart
Presenting this set of slides with name - Summary Financials Wc Analysis Roce Roe Ppt Model Smartart. This is a two stage process. The stages in this process are Roce And Roe, Working Capital Analysis, Trade Payables, Inventories, Trade Receivables.
-
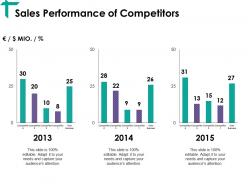 Sales performance of competitors ppt visual aids diagrams
Presenting this set of slides with name - Sales Performance Of Competitors Ppt Visual Aids Diagrams. This is a three stage process. The stages in this process are Business, Marketing, Strategy, Years, Graph.
-
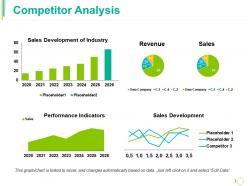 Competitor analysis ppt guide
Presenting this set of slides with name - Competitor Analysis Ppt Guide. This is a four stage process. The stages in this process are Development Of Industry, Revenue, Sales, Sales Development, Performance Indicators.
-
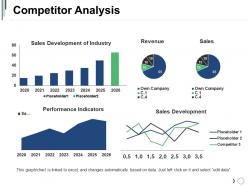 Competitor analysis presentation backgrounds
Presenting this set of slides with name - Competitor Analysis Presentation Backgrounds. This is a four stage process. The stages in this process are Business, Marketing, Strategy, Planning, Finance.
-
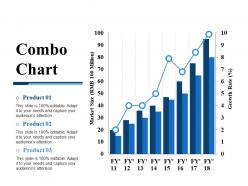 Combo chart powerpoint slide templates download
Presenting this set of slides with name - Combo Chart Powerpoint Slide Templates Download. This is a three stage process. The stages in this process are Combo Chart, Finance, Marketing, Analysis, Strategy, Growth.
-
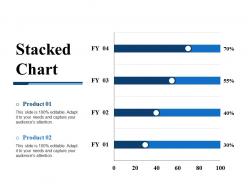 Stacked bar powerpoint slide influencers
Presenting this set of slides with name - Stacked Bar Powerpoint Slide Influencers. This is a four stage process. The stages in this process are Stacked Chart, Finance, Marketing, Analysis, Business.
-
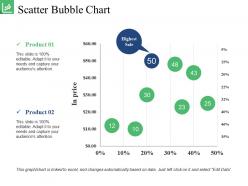 Scatter bubble chart powerpoint slide
Presenting this set of slides with name - Scatter Bubble Chart Powerpoint Slide. This is a two stage process. The stages in this process are Scatter Bubble Chart, Finance, Marketing, Strategy, Analysis.
-
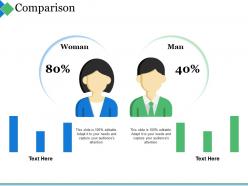 Comparison ppt summary design ideas
Presenting this set of slides with name - Comparison Ppt Summary Design Ideas. This is a two stage process. The stages in this process are Woman, Man, Comparison, Business, Marketing.
-
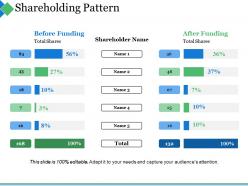 Shareholding pattern ppt summary professional
Presenting this set of slides with name - Shareholding Pattern Ppt Summary Professional. This is a five stage process. The stages in this process are Business, Marketing, Before Funding, Shareholder Name, After Funding.
-
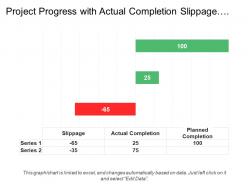 Project progress with actual completion slippage planned completion
Presenting this set of slides with name - Project Progress With Actual Completion Slippage Planned Completion. This is a three stage process. The stages in this process are Project Progress, Project Growth, Project Management.
-
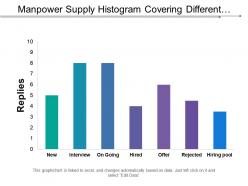 Manpower supply histogram covering different channel of recruitment of employees
Presenting this set of slides with name - Manpower Supply Histogram Covering Different Channel Of Recruitment Of Employees. This is a seven stage process. The stages in this process are Manpower Supply, Manpower Service, Manpower Recruitment.
-
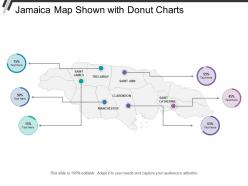 Jamaica map shown with donut charts
Presenting this set of slides with name - Jamaica Map Shown With Donut Charts. This is a six stage process. The stages in this process are Jamaica, Caribbean Island Nation, Caribbean Sea.
-
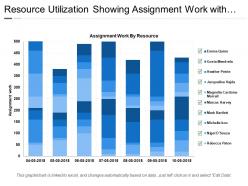 Resource utilization showing assignment work with dates
Presenting this set of slides with name - Resource Utilization Showing Assignment Work With Dates. This is a seven stage process. The stages in this process are Resource Management, Resource Utilization, Resource Allocation.
-
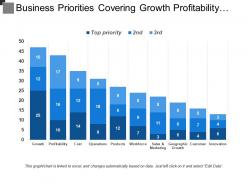 Business priorities covering growth profitability cost products and innovation
Presenting this set of slides with name - Business Priorities Covering Growth Profitability Cost Products And Innovation. This is a three stage process. The stages in this process are Business Priorities, Business Goals, Business Objectives.
-
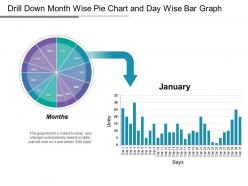 Drill down month wise pie chart and day wise bar graph
Presenting this set of slides with name - Drill Down Month Wise Pie Chart And Day Wise Bar Graph. This is a two stage process. The stages in this process are Drill Down, Hierarchy, Top Downwards.
-
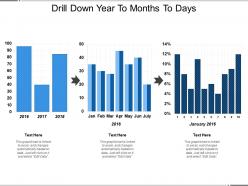 Drill down year to months to days
Presenting this set of slides with name - Drill Down Year To Months To Days. This is a three stage process. The stages in this process are Drill Down, Hierarchy, Top Downwards.
-
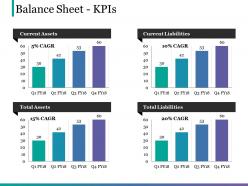 Balance sheet kpis powerpoint slide presentation tips
Presenting this set of slides with name - Balance Sheet Kpis Powerpoint Slide Presentation Tips. This is a four stage process. The stages in this process are Business, Current Assets, Current Liabilities, Total Liabilities, Total Assets.
-
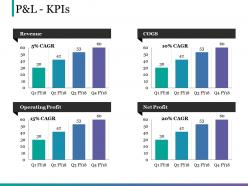 P and l kpis 2 powerpoint slides
Presenting this set of slides with name - P And L Kpis 2 Powerpoint Slides. This is a four stage process. The stages in this process are Business, Revenue, Cogs, Net Profit, Operating Profit.
-
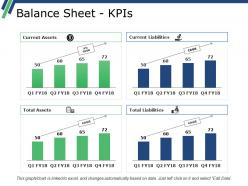 Balance sheet kpis ppt examples professional
Presenting this set of slides with name - Balance Sheet Kpis Ppt Examples Professional. This is a four stage process. The stages in this process are Balance Sheet, Finance, Marketing, Strategy, Analysis.
-
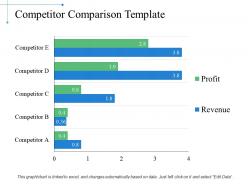 Competitor comparison powerpoint slide show
Presenting this set of slides with name - Competitor Comparison Powerpoint Slide Show. This is a five stage process. The stages in this process are Business, Marketing, Finance, Planning, Analysis.
-
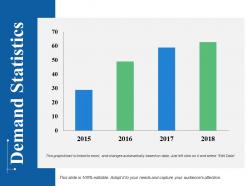 Demand statistics powerpoint slide themes
Presenting this set of slides with name - Demand Statistics Powerpoint Slide Themes. This is a four stage process. The stages in this process are Business, Marketing, Finance, Planning, Analysis.
-
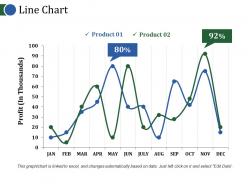 Line chart ppt background
Presenting this set of slides with name - Line Chart Ppt Background. This is a two stage process. The stages in this process are Line Chart, Growth, Strategy, Analysis, Business.
-
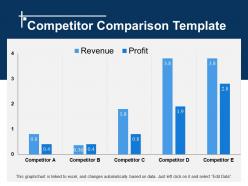 Competitor comparison template ppt examples
Presenting this set of slides with name - Competitor Comparison Template Ppt Examples. This is a five stage process. The stages in this process are Finance, Marketing, Bar, Planning, Growth.
-
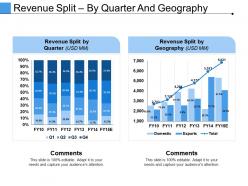 Revenue split by quarter and geography example of great ppt
Presenting this set of slides with name - Revenue Split By Quarter And Geography Example Of Great Ppt. This is a two stage process. The stages in this process are Finance, Marketing, Bar, Planning, Growth.
-
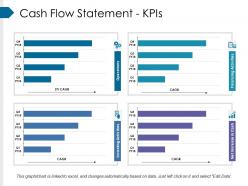 Cash flow statement kpis ppt background images
Presenting this set of slides with name - Cash Flow Statement Kpis Ppt Background Images. This is a four stage process. The stages in this process are Business, Marketing, Finance, Operations, Investing Activities, Net Increase In Cash, Financing Activities.
-
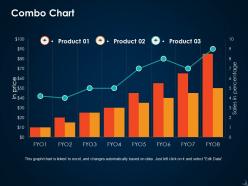 Combo chart ppt icon designs download
Presenting this set of slides with name - Combo Chart Ppt Icon Designs Download. This is a three stage process. The stages in this process are In Price, Sales In Percentage, Business, Marketing, Graph.
-
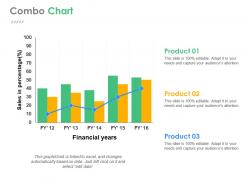 Combo chart ppt ideas
Well crafted and professionally equipped PowerPoint visual. There is use of bright and bold color graph for maximum visual appeal. Ease of editing every component of the PPT template. Guidance for executing the changes has been provided for assistance. Modify and personalize the presentation by including the company name and logo. PowerPoint is compatible with varied number of format options. And is also compatible with multiple software options available both online and offline. Widely used by entrepreneurs, business strategists, business analysts, stakeholders, students and teachers.
-
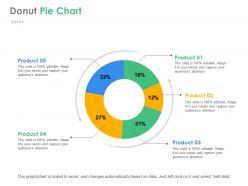 Donut pie chart ppt background designs
PPT is compatible with numerous format options like JPEG, JPG or PDF. Ease of modifying PowerPoint icons, colors, shades and orientation. There is freedom to customize it with company name and logo. You have access to inclusion and exclusion of contents as per specific needs of any business. High resolution images with splendid picture quality ensure zero issue of blur image, when projected on wide screen. Presentation is compatible with multiple software options. Widely used by business professionals, students, teachers, business analysts and strategists.
-
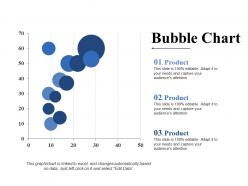 Bubble chart powerpoint slides design
Presenting bubble chart PowerPoint slides design PPT slide. The bubble chart design presentation slide designed professionally by the team of SlideTeam to present the magnitude of the parameter. The bubble chart and text placeholder in the bubble chart maker PPT template is customizable in PowerPoint. A user can do changes in numerical values as the bubble chart excel PowerPoint template get linked with Excel sheet. The bubble chart stock PowerPoint slide is also compatible with Google Slide. A user can edit the font size, font type, color and dimensions of the bubble chart concept PPT template.


