- Sub Categories
-
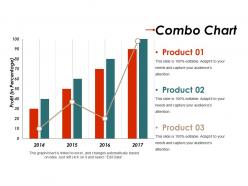 Combo chart good ppt example
Presenting combo chart good ppt example. This is a combo chart good ppt example. This is a three stage process. The stages in this process are product, profit, business, bar graph, success.
-
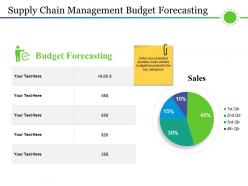 Supply chain management budget forecasting ppt example professional
Presenting Supply Chain Management Budget Forecasting PPT Example Professional which is completely editable. This template is compatible with Google Slides, which makes it accessible at once. Alter the colors, fonts, font size, and font types of the template as per the requirements. Can be changed into formats like PDF, JPG, and PNG. Freely access your presentation in both 4:3 and 16:9 aspect ratio.
-
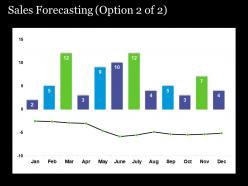 Sales forecasting powerpoint slide templates
Presenting sales forecasting powerpoint slide templates. This is a sales forecasting powerpoint slide templates. This is a two stage process. The stages in this process are bar, business, success, marketing, graph.
-
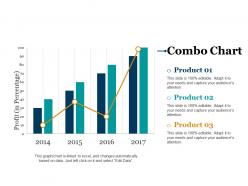 Combo chart powerpoint slide influencers
Presenting combo chart powerpoint slide influencers. This is a combo chart powerpoint slide influencers. This is a four stage process. The stages in this process are profit, combo chart, product.
-
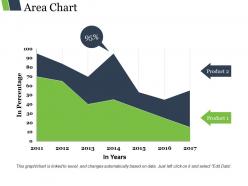 Area chart ppt design
Presenting area chart ppt design. This is a area chart ppt design. This is a two stage process. The stages in this process are product, in years, in percentage, percentage, finance.
-
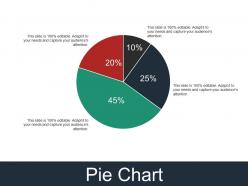 Pie chart presentation layouts template 2
Presenting Pie Chart Presentation Layouts Template 2. This slide is professionally designed and completely adaptable. It can be saved in various image and document formats such as JPEG, PNG or PDF. The slide is compatible with Google Slides. Moreover, both standard and widescreen aspect ratios are supported. The high quality of graphics ensures that there is no deterioration.
-
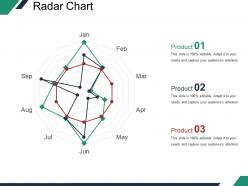 Radar chart presentation portfolio template 2
Presenting radar chart presentation portfolio template 2. This is a radar chart presentation portfolio template 2. This is a three stage process. The stages in this process are radar chart, marketing, business, product, shapes.
-
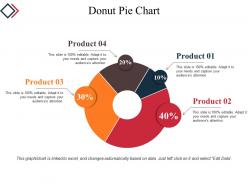 Donut pie chart powerpoint slide background image
Presenting donut pie chart powerpoint slide background image. This is a donut pie chart powerpoint slide background image. This is a four stage process. The stages in this process are donut, business, marketing, strategy, planning.
-
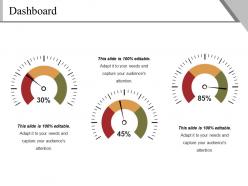 Dashboard powerpoint slide presentation examples
Presenting dashboard powerpoint slide presentation examples. This is a dashboard powerpoint slide presentation examples. This is a three stage process. The stages in this process are dashboard, finance, business, marketing, strategy.
-
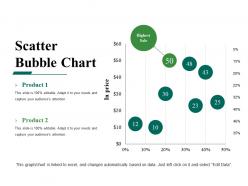 Scatter bubble chart powerpoint slide graphics
Presenting scatter bubble chart powerpoint slide graphics. This is a scatter bubble chart powerpoint slide graphics. This is a two stage process. The stages in this process are scatter bubble chart, product, process, marketing, business.
-
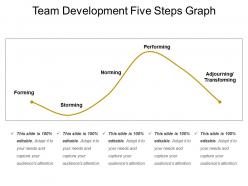 Team development five steps graph
Presenting the Team Development Five Steps Graph PowerPoint layout which is designed by our professionals for your convenience. This template is compatible with Google Slides which makes it easily accessible at once. You can save your presentation and open it in various formats like PDF, JPG, and PNG. Alter the colors, fonts, font size, and font types of the slide as per your requirements. You can freely access the slide in both 4:3 and 16:9 aspect ratio.
-
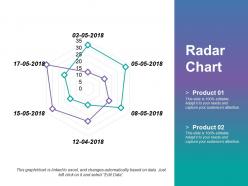 Radar chart powerpoint slide backgrounds
Presenting radar chart powerpoint slide backgrounds. This is a radar chart powerpoint slide backgrounds. This is a two stage process. The stages in this process are chart, business, marketing, finance.
-
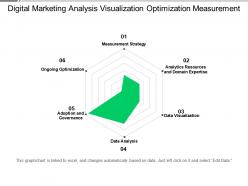 Digital marketing analysis visualization optimization measurement
Presenting this Digital Marketing Analysis Visualization Optimization Measurement PowerPoint presentation. Add charts and graphs for a wonderful representation of information. The PPT also supports the standard (4:3) and widescreen (16:9) aspect ratios. It is compatible with Google Slides. Convert this into popular images or document formats such as JPEG, PNG or PDF. High-quality graphics ensure that quality always remains the same.
-
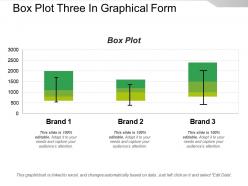 Box plot three in graphical form
Presenting the Box Plot Three In Graphical Form. Add appealing content like charts and graphs to the presentation. This template supports both the widescreen (16:9) and the standard screen aspect ratios(4:3). The slide is also compatible with Google Slides. This slide can be converted into common image formats like JPEG, PNG or document formats such as PDF. High-quality graphics will prevent the deterioration of slide components.
-
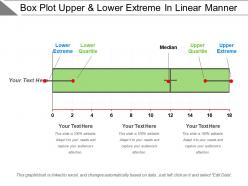 Box plot upper and lower extreme in linear manner
Presenting box plot upper and lower extreme in linear manner. This is a box plot upper and lower extreme in linear manner. This is a one stage process. The stages in this process are box plot, statistical data, whiskers plot, statistical distribution.
-
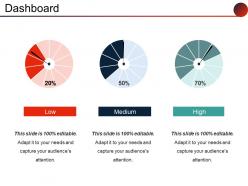 Dashboard powerpoint presentation
Presenting dashboard powerpoint presentation. This is a dashboard powerpoint presentation. This is a three stage process. The stages in this process are low, medium, high, pie, percentage.
-
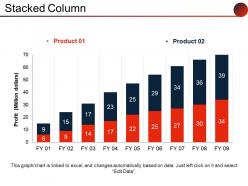 Stacked column powerpoint slide ideas
Presenting stacked column powerpoint slide ideas. This is a stacked column powerpoint slide ideas. This is a nine stage process. The stages in this process are profit, product, graph, growth, business.
-
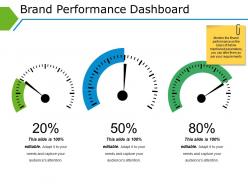 Brand performance dashboard powerpoint slide ideas
Presenting brand performance dashboard powerpoint slide ideas. This is a brand performance dashboard powerpoint slide ideas. This is a three stage process. The stages in this process are low, medium, high, dashboard, measurement.
-
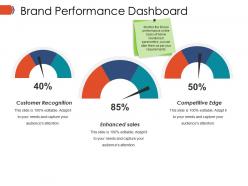 Brand performance dashboard snapshot ppt example
Presenting brand performance dashboard snapshot ppt example. This is a brand performance dashboard ppt example. This is a three stage process. The stages in this process are customer recognition, enhanced sales, competitive edge.
-
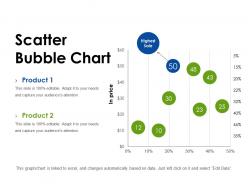 Scatter bubble chart powerpoint layout
Presenting scatter bubble chart powerpoint layout. This is a scatter bubble chart powerpoint layout. This is a two stage process. The stages in this process are scatter bubble chart, finance, analysis, marketing, strategy, business.
-
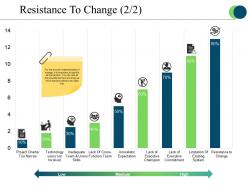 Resistance to change presentation ideas
Presenting resistance to change presentation ideas. This is a resistance to change presentation ideas. This is a nine stage process. The stages in this process are unrealistic expectation, project charter too narrow, resistance of change.
-
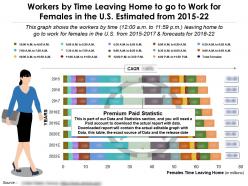 Workers by time leaving home to go to work for females in us estimated 2015-22
Presenting this set of slides with name - Workers By Time Leaving Home To Go To Work For Females In US Estimated 2015-22. Workers By Time Leaving Home To Go To Work For Females In The U.S Estimated From 2015 TO 22. This is part of our Data and Statistics products selection, and you will need a Paid account to download the actual report with accurate data. Downloaded report will contain the actual editable graph with the actual data, an excel table with the actual data, the exact source of the data and the release date. This graph shows the workers by time 12.00 a.m. to 11.59 p.m. leaving home to go to work for females in the U.S from 2015 TO 2017 and Forecasts for 2018 TO 22. It covers topic Workers by time leaving home to go to work for females for region USA and is for date range 2015 TO 22. Download it immediately and use it for your business.
-
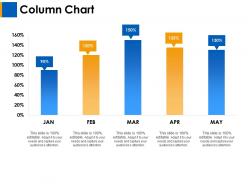 Column chart business planning ppt layouts background designs
Presenting this set of slides with name - Column Chart Business Planning Ppt Layouts Background Designs. This is a five stage process. The stages in this process are Finance, Analysis, Business, Investment, marketing.
-
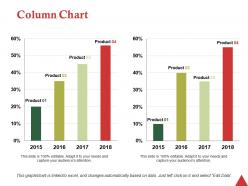 Column chart ppt professional styles
Presenting this set of slides with name - Column Chart Ppt Professional Styles. This is a two stage process. The stages in this process are Business, Management, Strategy, Analysis, Marketing.
-
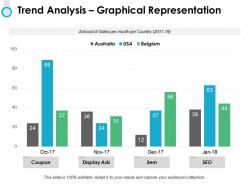 Trend analysis graphical representation ppt powerpoint presentation gallery design ideas
Presenting this set of slides with name - Trend Analysis Graphical Representation Ppt Powerpoint Presentation Gallery Design Ideas. This is a four stage process. The stages in this process are Percentage, Product, Business, Management, Marketing.
-
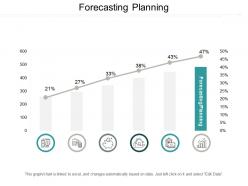 Forecasting planning ppt powerpoint presentation infographic template guide cpb
Presenting this set of slides with name - Forecasting Planning Ppt Powerpoint Presentation Infographic Template Guide Cpb. This is an editable six stages graphic that deals with topics like Forecasting Planning to help convey your message better graphically. This product is a premium product available for immediate download, and is 100 percent editable in Powerpoint. Download this now and use it in your presentations to impress your audience.
-
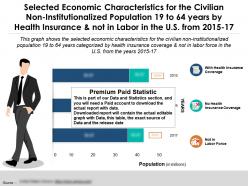 Economic characteristics population 19 to 64 years by health insurance not labor in us 2015-17
Presenting this set of slides with name - Economic Characteristics Population 19 To 64 Years By Health Insurance Not Labor In US 2015-17. Selected Economic Characteristics For The Civilian Noninstitutionalized Population 19 To 64 Years By Health Insurance And Not In Labor In The U.S From 2015 TO 17. This is part of our Data and Statistics products selection, and you will need a Paid account to download the actual report with accurate data. Downloaded report will contain the actual editable graph with the actual data, an excel table with the actual data, the exact source of the data and the release date. This graph shows the selected economic characteristics for the civilian noninstitutionalized population 19 to 64 years categorized by health insurance coverage and not in labor force in the U.S from the years 2015 TO 17. It covers topic Selected economic characteristics for population by health insurance and not in labor force for region USA and is for date range 2015 TO 17. Download it immediately and use it for your business.
-
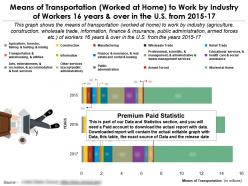 Means of transportation worked at home to work by industry of workers 16 years in us 2015-17
Presenting this set of slides with name - Means Of Transportation Worked At Home To Work By Industry Of Workers 16 Years In US 2015-17. Means Of Transportation Worked At Home To Work By Industry Of Workers 16 Years And Over In The U.S From 2015 to 17. This is part of our Data and Statistics products selection, and you will need a Paid account to download the actual report with accurate data. Downloaded report will contain the actual editable graph with the actual data, an excel table with the actual data, the exact source of the data and the release date. This graph shows the means of transportation worked at home to work by industry agriculture, construction, wholesale trade, information, finance and insurance, public administration, armed forces etc. of workers 16 years and over in the U.S from the years 2015 to 17. It covers topic Means of transportation by working from home for region USA and is for date range 2015 to 17. Download it immediately and use it for your business.
-
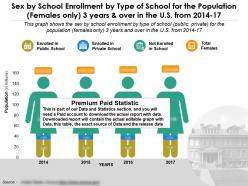 Sex by school enrollment by type of school population females only 3 years in us 2014-17
Presenting this set of slides with name - Sex By School Enrollment By Type Of School Population Females Only 3 Years In US 2014-17. Sex By School Enrollment By Type Of School For The Population Females Only 3 Years And Over In The U.S From 2014 TO 17. This is part of our Data and Statistics products selection, and you will need a Paid account to download the actual report with accurate data. Downloaded report will contain the actual editable graph with the actual data, an excel table with the actual data, the exact source of the data and the release date. This graph shows the sex by school enrollment by type of school public, private for the population females only 3 years and over in the U.S from 2014 TO 17. It covers topic School Enrollment for the population 3 years and over for females for region USA and is for date range 2014 TO 17. Download it immediately and use it for your business.
-
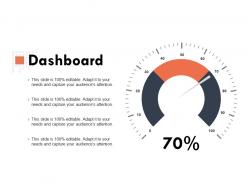 Dashboard finance ppt powerpoint presentation outline professional
Presenting this set of slides with name - Dashboard Finance Ppt Powerpoint Presentation Outline Professional. This is a one stage process. The stages in this process are Business, Planning, Strategy, Marketing, Management.
-
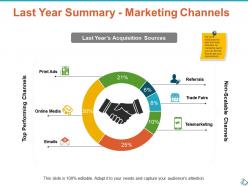 Last year summary marketing channels ppt show infographic template
Presenting this set of slides with name - Last Year Summary Marketing Channels Ppt Show Infographic Template. This is a six stage process. The stages in this process are Telemarketing, Canvassing, Referrals, Trade Fairs, Online Advertising.
-
 Column chart ppt powerpoint presentation file diagrams
Presenting this set of slides with name - Column Chart Ppt Powerpoint Presentation File Diagrams. This is a three stage process. The stages in this process are Percentage, Product, Business, Management, Marketing.
-
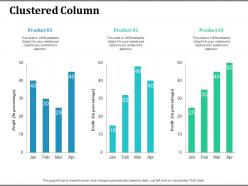 Clustered column in percentage product
Presenting this set of slides with name - Clustered Column In Percentage Product. This is a three stage process. The stages in this process are Clustered Column, Percentage, Product, Business.
-
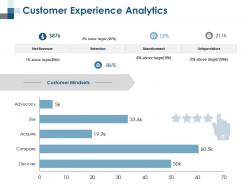 Customer experience analytics business ppt professional grid
Presenting this set of slides with name - Customer Experience Analytics Business Ppt Professional Grid. This is a four stage process. The stages in this process are Compare, Discover, Acquire, Retention, Abandonment.
-
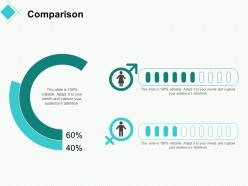 Comparison investment ppt powerpoint presentation professional examples
Presenting this set of slides with name - Comparison Investment Ppt Powerpoint Presentation Professional Examples. This is a two stage process. The stages in this process are Finance, Analysis, Business, Investment, Marketing.
-
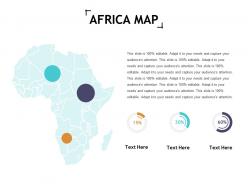 Africa map ppt show format ideas
Presenting this set of slides with name - Africa Map Ppt Show Format Ideas. This is a three stage process. The stages in this process are Business, Management, Strategy, Analysis, Marketing.
-
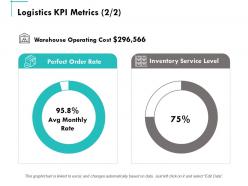 Logistics kpi metrics ppt powerpoint presentation summary template
Presenting this set of slides with name - Logistics Kpi Metrics Ppt Powerpoint Presentation Summary Template. This is a two stages process. The stages in this process are Finance, Marketing, Management, Investment, Analysis.
-
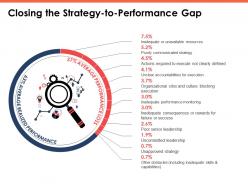 Closing the strategy to performance gap marketing ppt powerpoint presentation model skills
Presenting this set of slides with name - Closing The Strategy To Performance Gap Marketing Ppt Powerpoint Presentation Model Skills. This is a two stages process. The stages in this process are Finance, Marketing, Management, Investment, Analysis.
-
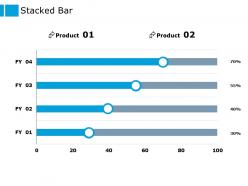 Stacked bar finance ppt powerpoint presentation pictures background image
Presenting this set of slides with name - Stacked Bar Finance Ppt Powerpoint Presentation Pictures Background Image. This is a two stages process are. The stages in this process are Stacked Bar, Marketing, Management, Investment, Analysis.
-
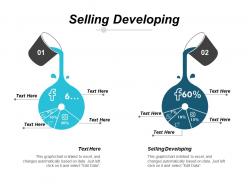 Selling developing ppt powerpoint presentation icon sample cpb
Presenting this set of slides with name - Selling Developing Ppt Powerpoint Presentation Icon Sample Cpb. This is an editable two stages graphic that deals with topics like Selling Developing to help convey your message better graphically. This product is a premium product available for immediate download, and is 100 percent editable in Powerpoint. Download this now and use it in your presentations to impress your audience.
-
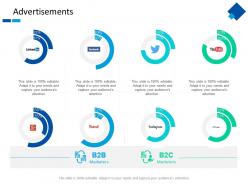 Advertisements finance ppt powerpoint presentation inspiration portrait
Presenting this set of slides with name - Advertisements Finance Ppt Powerpoint Presentation Inspiration Portrait. This is a eight stages process.The stages in this process are Finance, Marketing, Management, Investment, Analysis.
-
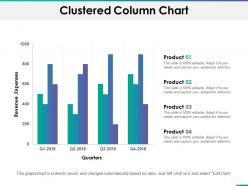 Clustered column chart ppt summary design templates
Presenting this set of slides with name - Clustered Column Chart Ppt Summary Design Templates. This is a four stage process. The stages in this process are Business, Management, Strategy, Analysis, Marketing.
-
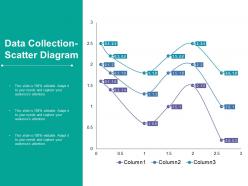 Data collection scatter diagram ppt styles infographics
Presenting this set of slides with name - Data Collection Scatter Diagram Ppt Styles Infographics. This is a three stage process. The stages in this process are Business, Management, Strategy, Analysis, Marketing.
-
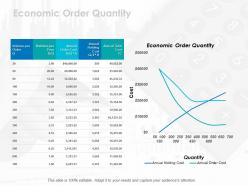 Economic order quantity ppt icon brochure
Presenting this set of slides with name - Economic Order Quantity Ppt Icon Brochure. This is a three stage process. The stages in this process are Business, Management, Strategy, Analysis, Icons.
-
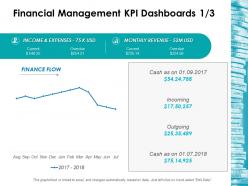 Financial management kpi dashboards 1 3 ppt inspiration structure
Presenting this set of slides with name - Financial Management Kpi Dashboards 1 3 Ppt Inspiration Structure. This is a four stage process. The stages in this process are Business, Management, Strategy, Analysis, Marketing.
-
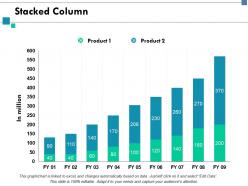 Stacked column finance ppt slides graphics tutorials
Presenting this set of slides with name - Stacked Column Finance Ppt Slides Graphics Tutorials. This is a two stage process. The stages in this process are Stacked Column, Finance, Marketing, Analysis, Investment.
-
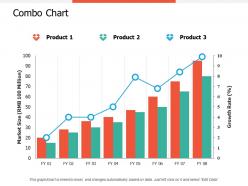 Combo chart finance ppt professional guidelines
Presenting this set of slides with name - Combo Chart Finance Ppt Professional Guidelines. This is a three stage process. The stages in this process are Combo Chart, Finance, Analysis, Business, Investment.
-
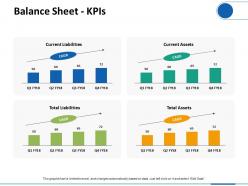 Balance sheet kpis ppt visual aids infographic template
Presenting this set of slides with name - Balance Sheet KPIs Ppt Visual Aids Infographic Template. This is a four stage process. The stages in this process are Finance, Analysis, Business, Investment, Marketing.
-
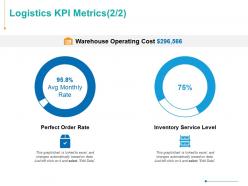 Logistics kpi metrics finance ppt powerpoint presentation show
Presenting this set of slides with name - Logistics KPI Metrics Finance Ppt Powerpoint Presentation Show. This is a two stage process. The stages in this process are Finance, Analysis, Business, Investment, Marketing.
-
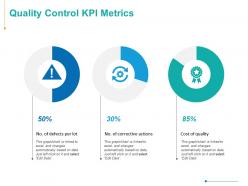 Quality control kpi metrics ppt powerpoint presentation inspiration diagrams
Presenting this set of slides with name - Quality Control KPI Metrics Ppt Powerpoint Presentation Inspiration Diagrams. This is a three stage process. The stages in this process are Finance, Analysis, Business, Investment, Marketing.
-
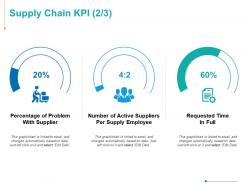 Supply chain kpi investment ppt powerpoint presentation infographics gridlines
Presenting this set of slides with name - Supply Chain KPI Investment Ppt Powerpoint Presentation Infographics Gridlines. This is a three stage process. The stages in this process are Finance, Analysis, Business, Investment, Marketing.
-
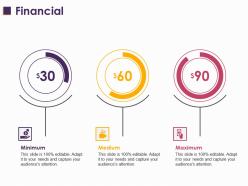 Financial ppt layouts topics
Presenting this set of slides with name - Financial Ppt Layouts Topics. This is a three stage process. The stages in this process are Business, Management, Strategy, Analysis, Marketing.
-
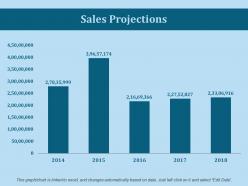 Sales projections ppt slides template
Presenting this set of slides with name - Sales Projections Ppt Slides Template. This is a five stage process. The stages in this process are Business, Management, Strategy, Analysis, Marketing.
-
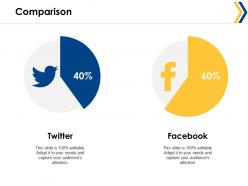 Comparison ppt summary graphics design
Presenting this set of slides with name - Comparison Ppt Summary Graphics Design. This is a two stage process. The stages in this process are Business, Management, Strategy, Analysis, Comparison.
-
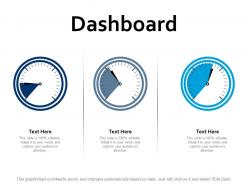 Dashboard snapshot ppt portfolio sample
Presenting this set of slides with name - Dashboard Snapshot Ppt Portfolio Sample. This is a three stage process. The stages in this process are Business, Management, Strategy, Analysis, Marketing.
-
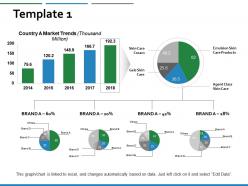 Market business management ppt powerpoint presentation inspiration portfolio
Presenting this set of slides with name - Market Business Management Ppt Powerpoint Presentation Inspiration Portfolio. This is a three stages process. The stages in this process are Bar Graph, Finance, Marketing, Business, Analysis.
-
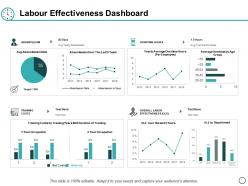 Labour effectiveness dashboard ppt powerpoint presentation diagram lists
Presenting this set of slides with name - Labour Effectiveness Dashboard Ppt Powerpoint Presentation Diagram Lists. This is a four stages process. The stages in this process are Bar Graph, Finance, Marketing, Business, Analysis.
-
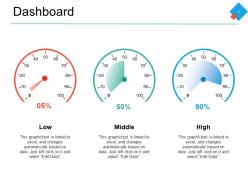 Dashboard snapshot ppt powerpoint presentation pictures samples
Presenting this set of slides with name - Dashboard Snapshot Ppt Powerpoint Presentation Pictures Samples. This is a three stage process. The stages in this process are Business, Marketing, Strategy, Management, Dashboard.
-
 Company sales analysis powerpoint slide ideas
Presenting company sales analysis powerpoint slide ideas. This is a company sales analysis powerpoint slide ideas. This is a eight stage process. The stages in this process are business, bar graph, time planning, strategy.
-
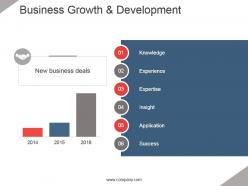 Business growth and development example of ppt
Presenting business growth and development example of ppt. This is a business growth and development example of ppt. This is a six stage process. The stages in this process are new business deals, knowledge, experience, expertise, insight, application, success.


