- Sub Categories
-
 Business planning and team discussion powerpoint images
Presenting business planning and team discussion powerpoint images. This is a business planning and team discussion powerpoint images. This is a five stage process. The stages in this process are work strategy, timeline, mission, success.
-
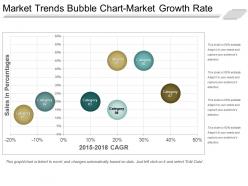 Market trends bubble chart market growth rate good ppt example
Presenting market trends bubble chart market growth rate good ppt example. This is a market trends bubble chart market growth rate good ppt example. This is a one stage process. The stages in this process are sales in percentages, category.
-
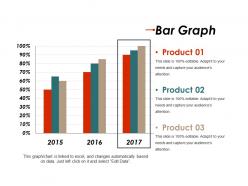 Bar graph powerpoint images
Presenting Bar Graph PowerPoint Images PowerPoint template. It is a fully customizable slide that totally works on your command. You are free to make changes in the slide. Alter anything, including its colors, backgrounds, text, and the icon. Adjust the size and shape of the icon. Add or remove the number of points and transform this slide into JPG and PDF file formats. Avail in standard screen size (4:3) and full-screen size (16:9).
-
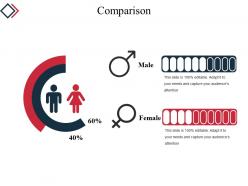 Comparison powerpoint templates
Presenting Comparison PowerPoint Templates presentation. This template is designed by experts. The slideshow is compatible with Google Slides and customizable in PowerPoint and other office suites. Modify the slide an innumerable number of times. You can add your company name or logo to the slide. The template can be converted into various image and document formats such as JPG, PDF, etc. with ease.
-
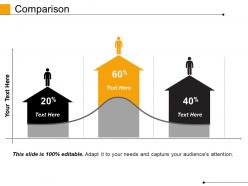 Comparison example of ppt
Presenting comparison example of ppt. This is a comparison example of ppt. This is a three stage process. The stages in this process are comparison, arrows, business, chart, marketing.
-
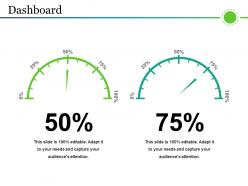 Dashboard snapshot powerpoint guide
Presenting the Dashboard Snapshot PowerPoint Guide template. The can be downloaded and saved in general image or document formats such as JPEG and PDF. Slideshow supports both the standard(4:3) and widescreen(16:9) sizes. Further, it is compatible with Google Slides and MS PowerPoint. You are free to alter the style, size, background and other attributes of the layout. High-quality graphics will ensure that the quality remains the same even you increase their size.
-
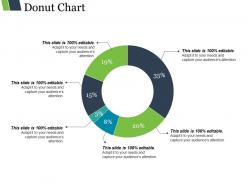 Donut chart presentation ideas
Presenting donut chart presentation ideas. This is a donut chart presentation ideas. This is a six stage process. The stages in this process are percentage, finance, donut, business.
-
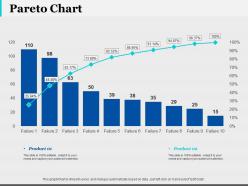 Pareto chart finance ppt infographic template infographic template
This is a two stage process. The stages in this process are Finance, Analysis, Business, Investment, Marketing.
-
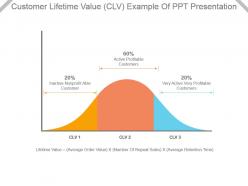 Customer lifetime value clv example of ppt presentation
Presenting customer lifetime value clv example of ppt presentation. Presenting customer lifetime value clv example of ppt presentation. Presenting customer lifetime value clv example of ppt presentation. This is a customer lifetime value clv example of ppt presentation. This is three stage process. The stages in this process are inactive nonprofit able customer, active profitable customers, very active very profitable customers.
-
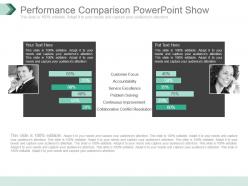 Performance comparison powerpoint show
Presenting performance comparison powerpoint show. This is a performance comparison powerpoint show. This is a two stage process. The stages in this process are customer focus, accountability, service excellence, problem solving, continuous improvement, collaborative conflict resolution.
-
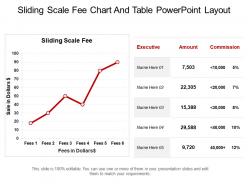 Sliding scale fee chart and table powerpoint layout
Presenting sliding scale fee chart and table powerpoint layout. This is a sliding scale fee chart and table powerpoint layout. This is a stage process. The stages in this process are executive, amount, commission, sale in dollars.
-
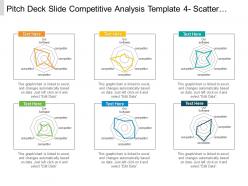 Pitch deck slide competitive analysis template 4 scatter chart radar chart ppt samples
Presenting Pitch Deck Slide Competitive Analysis Template 4 Scatter Chart Radar Chart PPT Samples. You can modify the color, fonts, font size, and font types of the template as per your requirements. The slide is available in both standard and widescreen. It is compatible with Google Slides which makes it accessible at once. Can be converted into formats like PDF, JPG, and PNG.
-
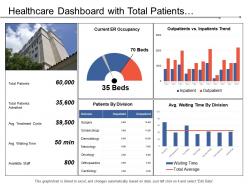 Healthcare dashboard with total patients admitted and average treatment cost
Presenting this set of slides with name - Healthcare Dashboard With Total Patients Admitted And Average Treatment Cost. This is a four stage process. The stages in this process are Healthcare, Health Improvement, Medical Care.
-
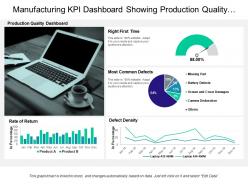 Manufacturing kpi dashboard showing production quality and defect density
Presenting this set of slides with name - Manufacturing Kpi Dashboard Showing Production Quality And Defect Density. This is a four stage process. The stages in this process are Manufacturing, Production, Manufacture.
-
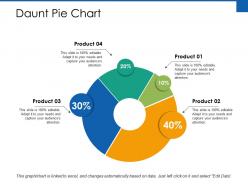 Daunt pie chart ppt powerpoint presentation summary
Presenting this set of slides with name - Daunt Pie Chart Ppt Powerpoint Presentation Summary. This is a four stages process. The stages in this process are Finance, Marketing, Management, Investment, Analysis.
-
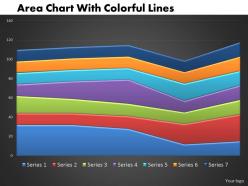 0414 area chart with colorful lines powerpoint graph
High-definition picture quality of the slide icons. Edit the color, change the theme, style and orientation of the slides. Replace the content with your business data. Prompt downloading and saving allowed. PPT design attune well with the Google slides. Use it on a wide display without effecting its quality. Useful for the marketing professionals and the business presenters.
-
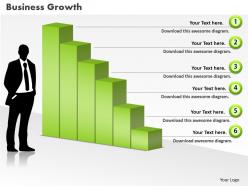 0414 business man with column chart powerpoint graph
Useful for professionals facilitating growth and progress related presentations. High definition graphics never pixilate if projected on bigger screens. Easily changeable into formats like JPEG and PDF. No space constraints for adding titles and sub-titles. Insert company’s logo, trademark or name accordingly. Easy to download and consumes less storage space. Compatible with Google slides and runs smoothly with softwares. Amendable in terms of color, orientation, design and font text.
-
 0414 human brain with an idea bar chart powerpoint graph
Simple and straightforward download without any hassles. Totally modifiable color scheme and contrast of high resolution PPT icons. Add text of any word length as per need. Change orientation and sizes of PPT images to your liking. Insert your brand name, trademark, company name, tagline, logo etc. Works seamlessly with Google slides and runs with other software too.
-
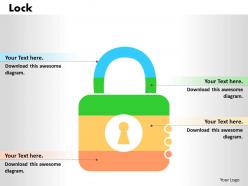 0414 lock icon business bar chart powerpoint graph
We are proud to present our 0414 lock icon business bar chart powerpoint graph. You have all the ingredients to create the taste of sucess. Garnish your recipe with our Lock Icon Business Bar Chart Powerpoint Graph Powerpoint Templates and enhance its flavour. Our Lock Icon Business Bar Chart Powerpoint Graph Powerpoint Templates are created by innovative young minds. Gauranteed to fit presentations of all kinds.
-
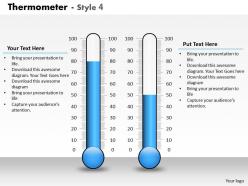 0414 thermometer column chart style graphics powerpoint graph
We are proud to present our 0414 thermometer column chart style graphics powerpoint graph. Put the wind in your sails with our Thermometer Column Chart Style Graphics Powerpoint Graph Powerpoint Templates. Skim smoothly over the choppy waters of the market. Let our Thermometer Column Chart Style Graphics Powerpoint Graph Powerpoint Templates give the updraft to your ideas. See them soar to great heights with ease.
-
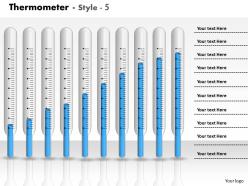 0414 thermometer column chart with 10 stages powerpoint graph
We are proud to present our 0414 thermometer column chart with 10 stages powerpoint graph. Bubbling and bursting with ideas are you. Let our Thermometer Column Chart With 10 Stages Powerpoint Graph Powerpoint Templates give them the shape for you. You have gained great respect for your brilliant ideas. Use our Thermometer Column Chart With 10 Stages Powerpoint Graph Powerpoint Templates to strengthen and enhance your reputation.
-
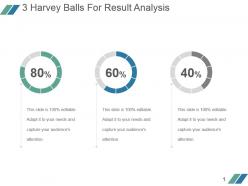 3 harvey balls for result analysis example of ppt
Presenting 3 harvey balls for result analysis example of ppt. This is a 3 harvey balls for result analysis example of ppt. This is a three stage process. The stages in this process are finance, process, business, marketing, percentage.
-
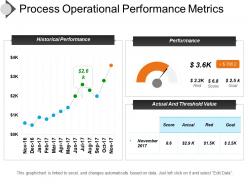 Process operational performance metrics presentation slides
Presenting process operational performance metrics presentation slides. PPT is useful in process performance measurement and improvement related slideshows. You can open the design template with Google Slides and PowerPoint. Images are fully supported on standard and wide screen views. Diagrams are fully editable in PowerPoint. You can change all the design components including font type, color, size, shape, background, images etc.
-
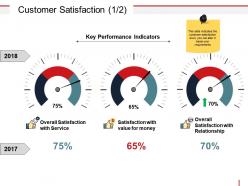 Customer satisfaction powerpoint images
Presenting customer satisfaction powerpoint images. This is a customer satisfaction powerpoint images. This is a three stage process. The stages in this process are key performance indicators, percentage, year, measurement, dashboard.
-
 Key statistics powerpoint slide templates
Presenting this set of slides with name - Key Statistics Powerpoint Slide Templates. This is a four stage process. The stages in this process are Pie Chart, Marketing, Analysis, Strategy, Business.
-
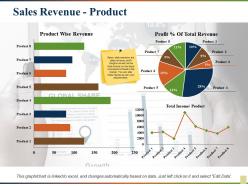 Sales revenue product revenue new customers gross profit
Presenting this set of slides with name - Sales Revenue Product Revenue New Customers Gross Profit. This is a eight stage process. The stages in this process are Product Wise Revenue, Profit Percentage Of Total Revenue, Total Income, Product.
-
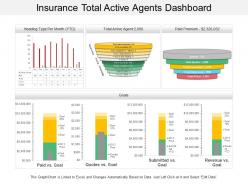 Insurance total active agents dashboard snapshot
• Multi colored beautifully designed visuals • Easy to download • Easy to customize and personalize • Ease of inclusion and exclusion of slide content as per company specific data • Thoroughly editable slides • High resolution visuals • Compatible with Google slides • Compatible with numerous forms format options available in market • Harmonious with multiple software options • Used by business analysts, insurance companies, insurance employees, and other such professionals.
-
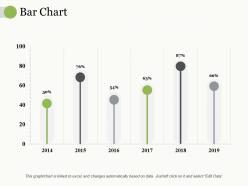 Bar chart ppt professional designs download
Presenting this set of slides with name - Bar Chart Ppt Professional Designs Download. This is a six stage process. The stages in this process are Business, Marketing, Percentage, Product.
-
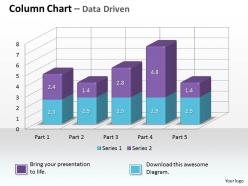 Data driven 3d chart to monitor business process powerpoint slides
We are proud to present our data driven 3d chart to monitor business process powerpoint slides. Deadlines Are An Element Of Todays Workplace. Our Data Driven 3D Chart To Monitor Business Process Powerpoint Slides Power Point Templates Help You Meet The Demand. Just Browse And Pick The Slides That Appeal To Your Intuitive Senses. Our Data Driven 3D Chart To Monitor Business Process Powerpoint Slides Power Point Templates Will Help You Be Quick Off The Draw. Just Enter Your Specific Text And See Your Points Hit Home.
-
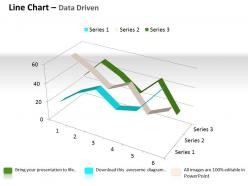 Data driven 3d line chart for comparison of data powerpoint slides
We are proud to present our data driven 3d line chart for comparison of data powerpoint slides. Our Data Driven 3D Line Chart For Comparison Of Data Powerpoint Slides Power Point Templates Are Building A Great Reputation. Of Being The Driving Force Of A Good Presentation. Use Our Data Driven 3D Line Chart For Comparison Of Data Powerpoint Slides Power Point Templates And Surely Win The Game. As A Presenter Gain Great Name And Fame.
-
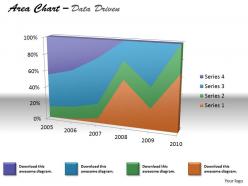 Data driven 3d area chart for various values powerpoint slides
We are proud to present our data driven 3d area chart for various values powerpoint slides. Our Data Driven 3D Area Chart For Various Values Powerpoint slides Power Point Templates Provide You With A Vast Range Of Viable Options. Select The Appropriate Ones And Just Fill In Your Text. Subscribe To Our Data Driven 3D Area Chart For Various Values Powerpoint slides Power Point Templates And Receive Great Value For Your Money. Be Assured Of Finding The Best Projection To Highlight Your Words.
-
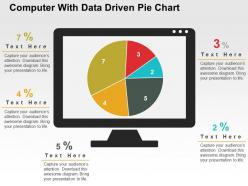 Computer with data driven pie chart powerpoint slides
Easy and swift to download. Fully modifiable color scheme, contrast, size and orientation of PPT infographics. Insert text without any length constraints. No change in the high resolution of PPT images after editing. Easily convertible to JPG or PDF formats and runs smoothly with any software. Perfectly suited for software designers, app developers, product engineers etc.
-
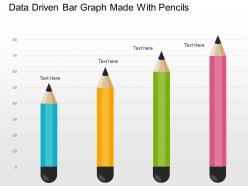 Data driven bar graph made with pencils powerpoint slides
Easy proofing and editing is added on feature of presentation visual. Presentation slide is useful in business marketing, management and recourse disbursement. Basic theme yet it can modified with respect to font, color and layout. Attractive color scheme gives a professional look to PPT layout. Conversion into PDF or JPG formats is very easy and handy. PPT graphic offers font size which can be read from a distance. Shapes are in vector format and can be edited.
-
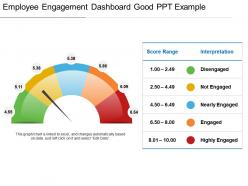 Employee engagement dashboard snapshot good ppt example
Presenting employee engagement dashboard snapshot good PPT example presentation slides. Simple data input like company logo, name or trademark. This PowerPoint template is fully supported by Google Slides. User can edit the data in linked excel sheet and graphs and charts gets customized accordingly. This layout offers fast downloading speed and formats can be easily changed to JPEG and PDF applications. This template is suitable for marketing, sales persons, business managers and entrepreneurs. Adjust PPT layout, font, text and color as per your necessity.
-
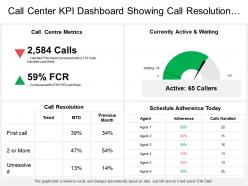 Call center kpi dashboard showing call resolution currently active and waiting
Presenting this set of slides with name - Call Center Kpi Dashboard Showing Call Resolution Currently Active And Waiting. This is a one stage process. The stages in this process are Call Center Agent, Customer Care, Client Support.
-
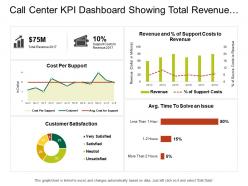 Call center kpi dashboard showing total revenue customer satisfaction costs per support
Presenting this set of slides with name - Call Center Kpi Dashboard Showing Total Revenue Customer Satisfaction Costs Per Support. This is a four stage process. The stages in this process are Call Center Agent, Customer Care, Client Support.
-
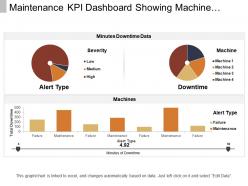 Maintenance kpi dashboard showing machine downtime and alert type
Presenting this set of slides with name - Maintenance Kpi Dashboard Showing Machine Downtime And Alert Type. This is a three stage process. The stages in this process are Maintenance, Preservation, Conservation.
-
 Workforce kpi dashboard showing average age female percentage and average tenure
Presenting this set of slides with name - Workforce Kpi Dashboard Showing Average Age Female Percentage And Average Tenure. This is a four stage process. The stages in this process are Staff, Personnel, Workforce.
-
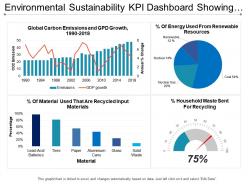 Environmental sustainability kpi dashboard showing global carbon emission and gdp growth
Presenting this set of slides with name - Environmental Sustainability Kpi Dashboard Showing Global Carbon Emission And Gdp Growth. This is a four stage process. The stages in this process are Environment Sustainability, Environment Continual, Environment Feasibility.
-
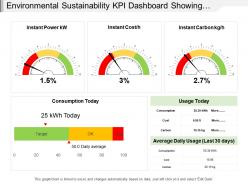 Environmental sustainability kpi dashboard showing instant power cost carbon and consumption
Presenting this set of slides with name - Environmental Sustainability Kpi Dashboard Showing Instant Power Cost Carbon And Consumption. This is a three stage process. The stages in this process are Environment Sustainability, Environment Continual, Environment Feasibility.
-
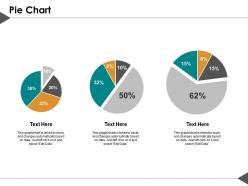 Pie chart ppt summary graphics tutorials
Presenting this set of slides with name - Pie Chart Ppt Summary Graphics Tutorials. This is a three stage process. The stages in this process are Percentage, Product, Business, Management, Marketing.
-
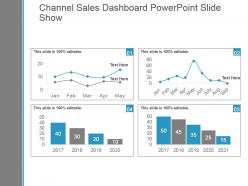 Channel sales dashboard powerpoint slide show
Presenting channel sales dashboard powerpoint slide show. This is a channel sales dashboard powerpoint slide show. This is a four stage process. The stages in this process are business, marketing, line chart, dashboard, management.
-
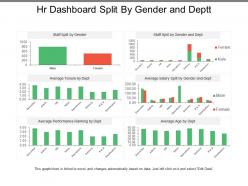 Hr dashboard split by gender and deptt
Presenting this set of slides with name - Hr Dashboard Split By Gender And Deptt. This is a six stage process. The stages in this process are Hr Dashboard, Human Resource Dashboard, Hr Kpi.
-
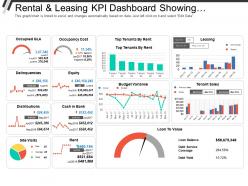 Rental and leasing kpi dashboard showing occupancy cost equity loan to value
Presenting this set of slides with name - Rental And Leasing Kpi Dashboard Showing Occupancy Cost Equity Loan To Value. This is a three stage process. The stages in this process are Rental And Leasing, Dealing And Leasing, Rental And Engage.
-
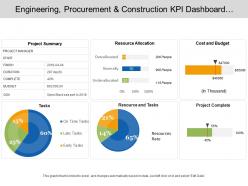 Engineering procurement and construction kpi dashboard showing project summary cost and budget
Presenting this set of slides with name - Engineering Procurement And Construction Kpi Dashboard Showing Project Summary Cost And Budget. This is a four stage process. The stages in this process are Engineering, Procurement And Construction, Construction Management, Engineering, Purchasing And Construction .
-
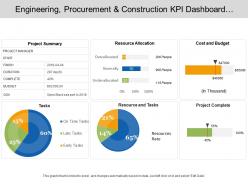 Engineering procurement and construction kpi dashboard showcasing project summary cost and budget
Presenting this set of slides with name - Engineering Procurement And Construction Kpi Dashboard Showcasing Project Summary Cost And Budget. This is a five stage process. The stages in this process are Engineering, Procurement And Construction, Construction Management, Engineering, Purchasing And Construction .
-
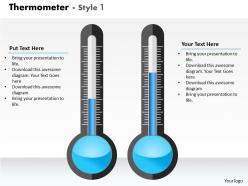 0414 thermometer column chart to display data powerpoint graph
We are proud to present our 0414 thermometer column chart to display data powerpoint graph. Let our Thermometer Column Chart To Display Data Powerpoint Graph Powerpoint Templates mark the footprints of your journey. Illustrate how they will lead you to your desired destination. Conjure up grand ideas with our magical Thermometer Column Chart To Display Data Powerpoint Graph Powerpoint Templates. Leave everyone awestruck by the end of your presentation.
-
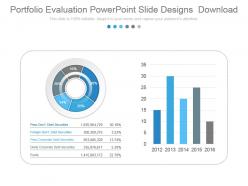 Portfolio evaluation powerpoint slide designs download
Presenting portfolio evaluation powerpoint slide designs download. This is a portfolio evaluation powerpoint slide designs download. This is a two stage process. The stages in this process are peso govt debt securities, foreign govt debt securities, peso corporate debt securities, dollar corporate debt securities, equity.
-
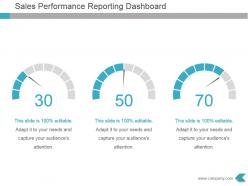 Sales performance reporting dashboard powerpoint template
Presenting sales performance reporting dashboard powerpoint template. This is a sales performance reporting dashboard powerpoint template. This is a three stage process. The stages in this process are dashboard, management, process, strategy, analysis.
-
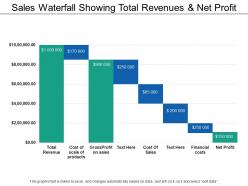 Sales waterfall showing total revenues and net profit
Presenting this set of slides with name - Sales Waterfall Showing Total Revenues And Net Profit. This is a eight stage process. The stages in this process are Sales Waterfall, Waterfall Chart.
-
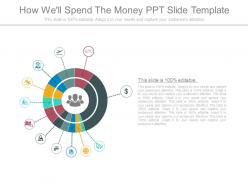 How well spend the money ppt slide template
Presenting how well spend the money ppt slide template. This is a how well spend the money ppt slide template. This is a twelve stage process. The stages in this process are business, management, strategy, icons, process.
-
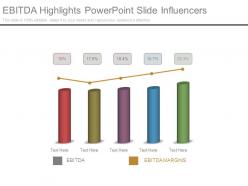 Ebitda highlights powerpoint slide influencers
Presenting ebitda highlights powerpoint slide influencers. This is a ebitda highlights powerpoint slide influencers. This is a five stage process. The stages in this process are graph chart, strategy, management, business, success.
-
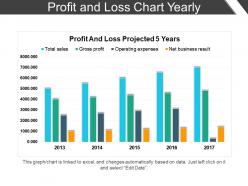 Profit and loss chart yearly powerpoint slide backgrounds
Presenting Profit And Loss Chart Yearly PowerPoint Slide Backgrounds. This PPT slide is professionally made and easily customizable. A mere click can easily edit the font style, font color, and font size. Access this presentation easily anywhere as it is compatible with Google Slides. Transform it in PDF or JPG formats. Add or delete content from the given slide as per your convenience. Present it in front of thousands of people in widescreen. It is also available in standard screen size.
-
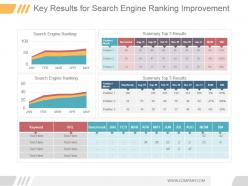 Key results for search engine ranking improvement good ppt example
Presenting key results for search engine ranking improvement good ppt example. This is a key results for search engine ranking improvement good ppt example. This is a three stage process. The stages in this process are search engine ranking, summary top 3 results, jan, feb, mar, apr, may, position month, position, aug, sep, oct, nov, dec, mom, bm, url, keyword.
-
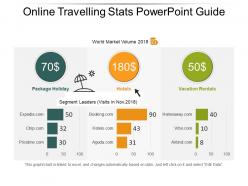 Online travelling stats powerpoint guide
Presenting online traveling stats PowerPoint guide. Quickly adjust the color schemes used here and join text to personalize the layout. Compatible with Google Slides and can be converted into jpg or pdf formats by ensuring a few steps. This PPT deck can be easily converted into pdf or jpeg format just by following a few simsple steps. Include your traveling plans/packages in this PPT design and use in both standard 4:3 and widescreen format 16:9 after downloading. This is an entirely editable and high-resolution design which do not pixelate when elongated on a widescreen. Download this predesigned format in seconds.
-
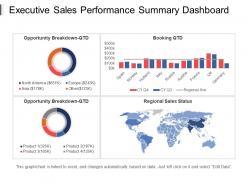 Executive sales performance summary dashboard ppt slide templates
Presenting executive sales performance summary dashboard PPT slide templates PPT slide. Vector-based designing. High-resolution visuals which do not pixelate when projected on a wide screen. Ease of personalization and customization. Add or exclude company-specific content at your choice. Guidelines for executing the changes have been provided for convenience. PPT is compatible with Windows, Mac and other formats and software options. Used by professionals belonging to multiple organizations. Ease of download.
-
 Scatter bubble chart ppt summary aids
Presenting this set of slides with name - Scatter Bubble Chart Ppt Summary Aids. This is a three stage process. The stages in this process are Scatter Chart, Product, Growth, Success.
-
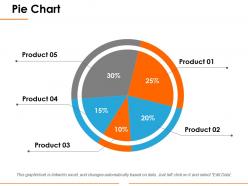 Pie chart ppt introduction
Presenting the flat pie chart PPT template. This presentation template is designed under the supervision of professionals and is 100% modifiable in PowerPoint. The user can bring changes to the objects like font color and font size in this slide and save it in JPG or PDF file format hassle-free. This slide is 100% compatible with Google Slide. Click on the download tab below to download this template in no time.
-
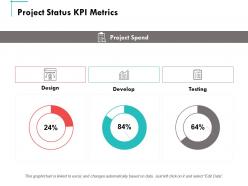 Project status kpi metrics develop ppt powerpoint presentation summary aids
Presenting this set of slides with name - Project Status Kpi Metrics Develop Ppt Powerpoint Presentation Summary Aids. This is a three stages process. The stages in this process are Finance, Marketing, Management, Investment, Analysis.
-
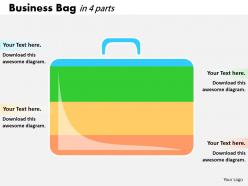 0414 business bag illustration bar chart powerpoint graph
We are proud to present our 0414 business bag illustration bar chart powerpoint graph. Our 0414 Business Bag Illustration Bar Chart Powerpoint Graph Powerpoint Templates are created with admirable insight. Use them and give your group a sense of your logical mind. Use our 0414 Business Bag Illustration Bar Chart Powerpoint Graph Powerpoint Templates to bullet point your ideas. See them fall into place one by one.


