- Sub Categories
-
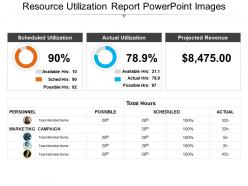 Resource utilization report powerpoint images
Presenting resource utilization report PowerPoint images PPT slide. This is a self-explanatory and intellectual slide design. There is the use of visually impressive colors and stunning picture quality. High-resolution images do not pixelate when projected on a wide screen. PPT is compatible with numerous software and format options. 100 percent editable slide design components. Modify the presentation elements as per the need of the hour. Personalize the PPT with your company name and logo. Used by entrepreneurs, marketers, managerial department, stakeholders and students.
-
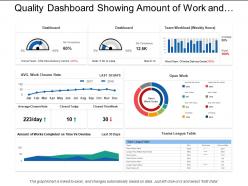 Quality dashboard showing amount of work and the percentage charts
SlideTeam presents to you its quality dashboard showing amount of work and the percentage charts.You can also alter the font size, font color and font style of the text so used in the slides. The business template can be saved in format of PDF or JPG as per your requirements. So download this slideshow and make most of it.
-
 0414 percentage profit growth column chart powerpoint graph
All images are 100% editable in the presentation design. Changing the color, size and orientation of any icon to your liking is manageable in presentation slide. PPT design supports the best graphic features; icon list can be re arranged according to the requirement. Smooth animations, transitions and movement of objects across the slide. Beneficial by businessmen in marketing, service and sales departments and students.
-
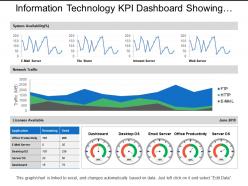 Information technology kpi dashboard showing network traffic system availability
Presenting information technology KPI dashboard showing network traffic system PowerPoint template. Choice to view PowerPoint design in standard and widescreen view. Fully editable Presentation dashboards that can be edited as needed. Easy to download and insert in the ongoing presentation. Convertible into Jpeg and Pdf document. Suitable for managers, leaders, sales and marketing people, analysts, etc. Slides are designed using latest management tools and techniques. The high-resolution view is altogether an experience with a brilliant impact.
-
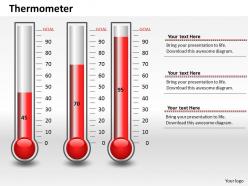 0414 thermometer column chart graphics powerpoint graph
All images are 100% editable in the presentation design. Presentation slide supports changing the color, size and orientation of any icon to your liking. PPT design supports the best graphic features; objects can be re arranged according to the requirement. Smooth animations, transitions and movement of objects across the slide. PPT slide is beneficial in business, academics, science, weather and science projections.
-
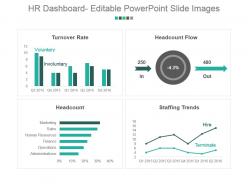 Hr dashboard editable powerpoint slide images
Stunning HR dashboard editable PPT slideshow. Loaded with incomparable benefits. Readymade PPT graphic helps in saving time and effort. Can be personalized by adding company trademark, logo, brand and symbols. Can be utilized for displaying both simple and complex information. Include or exclude slide content as per your individual need. Colors and text can be easily changed as the PPT slide is completely editable. Useful for every business leader and professional, project management team, business analysts, etc.
-
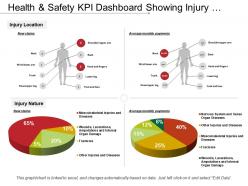 Health and safety kpi dashboard showing injury location and injury nature
Presenting the KPI dashboard PPT slide. This PPT template is fully editable and is designed by professionals looking for a professional presentation. You can edit the objects in the slide like font size and font color easily. This presentation slide is fully compatible with Google Slide and can be saved in JPG or PDF file format easily. Click on the download button below.
-
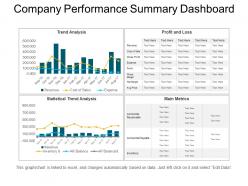 Company performance summary dashboard ppt slide examples
Presenting company performance summary dashboard PPT design. They are 100% expertly crafted Presentation graphics. They are quite compatible with all software’s and Google Slides. They have a feature to redesign all the available shapes, patterns, and matters etc. They have an authentic and relevant PPT images with limber data options and can easily add company name or logo.
-
 Budget forecast showing expense management and expenses
Presenting this set of slides with name - Budget Forecast Showing Expense Management And Expenses. This is a three stage process. The stages in this process are Budget Forecast, Forecast Vs Actual Budget, Plan Vs Forecast.
-
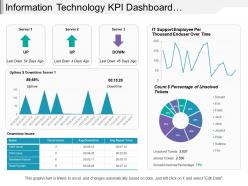 Information technology kpi dashboard showing downtime issues unsolved tickets
Presenting this set of slides with name - Information Technology Kpi Dashboard Showing Downtime Issues Unsolved Tickets. This is a four stage process. The stages in this process are Information Technology, It, Iot.
-
 Parallel timeline schedule
Presenting parallel timeline schedule. This is a parallel timeline schedule. This is a four stage process. The stages in this process are parallel timeline, parallel roadmap, parallel linear process.
-
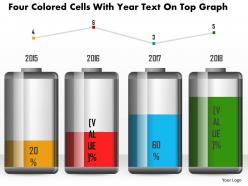 1214 four colored cells with year text on top graph powerpoint slide
We are proud to present our 1214 four colored cells with year text on top graph powerpoint slide. This Power Point template slide has been crafted with graphic of four colored cells and year text on top with graph. This PPT slide is usable for power technology and energy conservation related presentations.
-
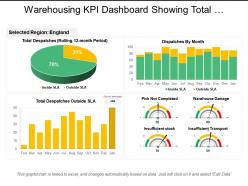 Warehousing kpi dashboard showing total dispatches
This highly versatile PPT design is completely editable; you can modify and personalize the design according to your business needs. You can use excel linked chart to display your business related and figures in presentation. PPT slides are easily downloadable as JPEG or PDF formats. Design can be opened both in standard and wide screen view; no change on design quality on full screen view.
-
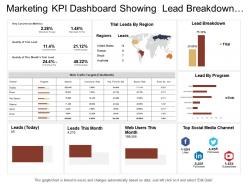 Marketing kpi dashboard showing lead breakdown web traffic targets
Presenting this set of slides with name - Marketing Kpi Dashboard Showing Lead Breakdown Web Traffic Targets. This is a three stage process. The stages in this process are Marketing, Branding, Promoting.
-
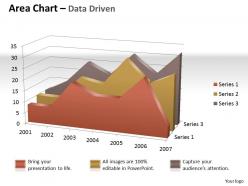 Data driven 3d visual display of 3d area chart powerpoint slides
We are proud to present our data driven 3d visual display of 3d area chart powerpoint slides. Our Data Driven 3D Visual Display Of 3d Area Chart Powerpoint Slides Power Point Templates Provide You The Cutting Edge. Slice Through The Doubts In The Minds Of Your Listeners. You Aspire To Touch The Sky With Glory. Let Our Data Driven 3D Visual Display Of 3d Area Chart Powerpoint Slides Power Point Templates Provide The Fuel For Your Ascent.
-
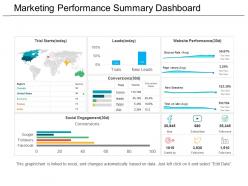 Marketing performance summary dashboard snapshot ppt templates
Presenting marketing performance summary dashboard snapshot PPT templates PPT slide. Presentation can be viewed on widescreen as the visuals do not pixelate. All the elements of the slide background can be tailored to individual needs. The presentation template can be incorporated in any of the desired format (JPEG/PDF) Guidance for editing of the PPT visual diagram is provided. Easy to edit and customize PPT graphics. Compatible with all software and can be saved in any format (JPEG/JPG/PDF).
-
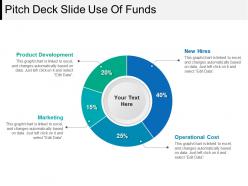 Pitch deck slide use of funds powerpoint show
Presenting Pitch Deck Slide Use Of Funds PowerPoint Show. You can make the necessary alterations in the font color, font size, and font style of the slide as it is entirely customizable. The color of the text and background can be formatted. You can add or edit text anywhere in the PowerPoint template. Its compatibility with Google Slides makes it accessible at once. You can transform and save the slide in PDF and JPG formats as well. Get this high-quality slide to add value to your presentation and present it in front of thousands of people on standard screen and widescreen.
-
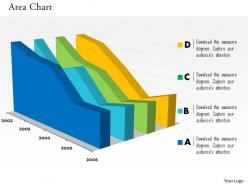 0514 year based data driven area chart powerpoint slides
Easy customization like company logo, name or trademark. This PowerPoint icon is fully aligned with Google slides. Picture quality does not change even when project this template on large screen. Fast downloading speed and formats can be simply altered to JPEG and PDF. Easy to connect with marketing, sales persons and entrepreneurs. Change PPT slide’s font, text, and colors as per your requirements.
-
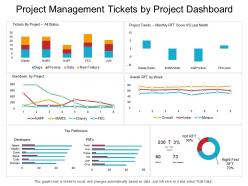 Project management tickets by project dashboard
Presenting this set of slides with name - Project Management Tickets By Project Dashboard. This is a six stage process. The stages in this process are Project Proposal, Project Plan, Project Management.
-
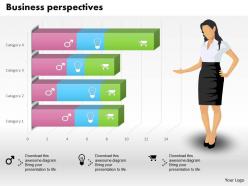 0514 data driven business prospective diagram powerpoint slides
We are proud to present our 0514 data driven business prospective diagram powerpoint slides. Explain business prospective data driven result for any business. To do this use our creative Business Power Point template in your presentation and get all attention.
-
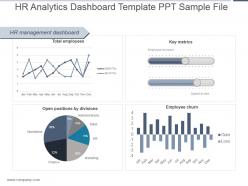 Hr analytics dashboard template ppt sample file
Presenting hr analytics dashboard template ppt sample file. This is a hr analytics dashboard template ppt sample file. This is a four stage process. The stages in this process are hr management dashboard, total employees, key metrics, employee turnover, speed to hire, ftes, jan, feb, mar, apr, may, june, july, aug, sep, oct, nov, dec, open positions by divisions, operations, administrations, sales, hr, marketing, finance, gain, loss, employee churn.
-
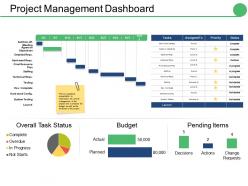 Project management dashboard snapshot ppt show graphics
Presenting this set of slides with name - Project Management Dashboard Snapshot Ppt Show Graphics. This is a four stage process. The stages in this process are Actual, Planned, Budget, Pending Items, Overdue.
-
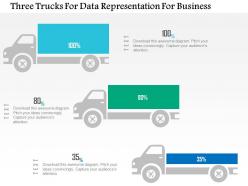 1214 three trucks for data representation for business powerpoint slide
We are proud to present our 1214 three trucks for data representation for business powerpoint slide. This Power Point template slide has been designed with graphic of three trucks. These trucks are used as a data representation. Use this PPT slide for your business data related presentations.
-
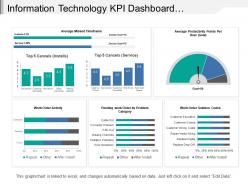 Information technology kpi dashboard showing work order activity
Presenting this set of slides with name - Information Technology Kpi Dashboard Showing Work Order Activity. This is a six stage process. The stages in this process are Information Technology, It, Iot.
-
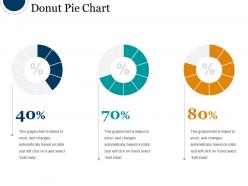 Donut pie chart powerpoint slide presentation examples
Presenting Donut Pie Chart PowerPoint Slide Presentation Examples which is completely editable. Open and save your presentation in various formats like PDF, JPG, and PNG. This template is compatible with Google Slides which makes it easily accessible at once. This slide is available in both 4:3 and 16:9 aspect ratio. Alter the font, color, font size, and font types of the slides as per your needs.
-
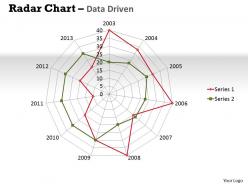 Data driven radar chart displays multivariate data powerpoint slides
We are proud to present our data driven radar chart displays multivariate data powerpoint slides. There are a variety of different kinds of business data that you can use to display the information compiled in your reports. This ppt diagram making this process extremely easy to convert information into charts and graphs.
-
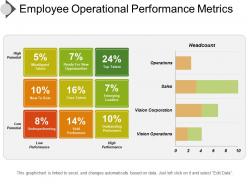 Employee operational performance metrics ppt image
Presenting employee operational performance metrics PPT image. PPT is perfect for employee performance assessment and management. Downloads are 100% error free. Images are compatible with Google Slides and MS PowerPoint. Presentation is useful for corporate business managers, trainers, HR professionals. The presentation can be opened with Google Slides and Microsoft PowerPoint. Download and convert the design into JPEG and PDF formats.
-
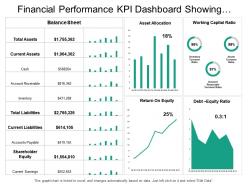 Financial performance kpi dashboard showing asset allocation balance sheet
Presenting this set of slides with name - Financial Performance Kpi Dashboard Showing Asset Allocation Balance Sheet. This is a two stage process. The stages in this process are Financial Performance, Financial Report, Financial Review.
-
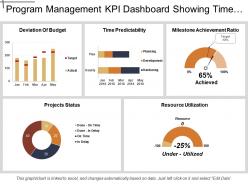 Program management kpi dashboard showing time predictability and resource utilization
Presenting Program Management KPI Dashboard Showing Time Predictability And Resource Utilization PPT slide. The graphical Program Management dashboard PowerPoint template designed by the professional team of SlideTeam to present the different parameters that are essential for any project. The different charts such as line and pie chart, along with that the text in the KPI dashboard slide are editable in PowerPoint. Moreover, this slide is compatible with Google Slide. An individual can edit the font size, font type, color and dimensions of the different figures according to the requirement.
-
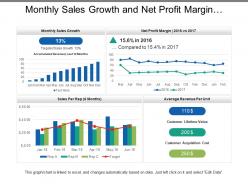 Monthly sales growth and net profit margin dashboard
Presenting this set of slides with name - Monthly Sales Growth And Net Profit Margin Dashboard. This is a four stage process. The stages in this process are Sales Dashboard, Sales Kpis, Sales Performance.
-
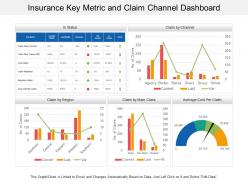 Insurance key metric and claim channel dashboard
• Easy to customize. • Easy to replace any words, picture or number provided in the template with your own content and use it for presentation. • Freedom to incorporate your own company’s name and logo in the presentation for personalization. • The PPT visuals used are of high resolution. • No issue of image pixilation if projected on wide screen. • Compatibility with numerous format and software options. • Widely used by marketers, businessmen, insurance managers and educators.
-
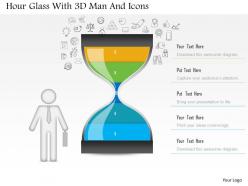 1214 hour glass with 3d man and icons powerpoint slide
We are proud to present our 1214 hour glass with 3d man and icons powerpoint slide. Graphic of hour glass and 3d man with icons are used to craft this power point template slide. This PPT slide contains the concept of time management. Use this PPT slide for all your time related presentations.
-
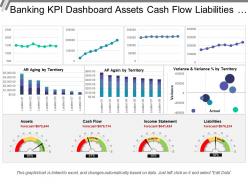 Banking kpi dashboard assets cash flow liabilities income statement
Presenting this set of slides with name - Banking Kpi Dashboard Assets Cash Flow Liabilities Income Statement. This is a three stage process. The stages in this process are Banking, Finance, Money.
-
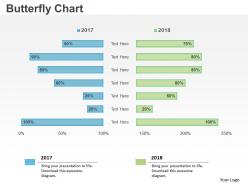 0414 business butterfly bar chart powerpoint graph
Presenting 0414 business butterfly bar chart PowerPoint graph PPT slide. High-resolution visuals. No fear of image pixelation when projected on a large screen. Thoroughly editable PowerPoint pictures. Ease of executing changes in the content of the slide. Easy to customize and personalize the PowerPoint slides with company-specific name, logo, and trademark. Ease of download and can be saved in any format of one’s choice. Compatible with numerous software options available both online and offline. Applicable by a number of marketing and nonmarketing executives, students, and teachers.
-
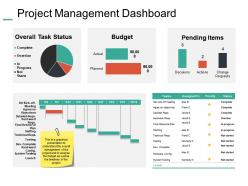 Project management dashboard snapshot ppt summary example introduction
Presenting this set of slides with name - Project Management Dashboard Snapshot Ppt Summary Example Introduction. This is a three stage process. The stages in this process are Budget, Pending Items, Change Request, Decision, Actions.
-
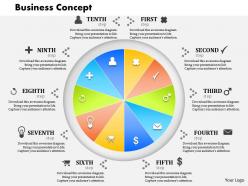 0514 business concept data driven display for sales powerpoint slides
High resolution visuals which does not deter in quality when projected on wide screen. Impressive and eye catchy images. Compatibility with multiple numbers of software options. Compatible with numerous formats. Compatible with Google slides, Mac and Windows. Ease of download. Thoroughly editable slide design visual. Ease of inclusion and exclusion of content. Ease of personalization with company specific name, logo and trademark.
-
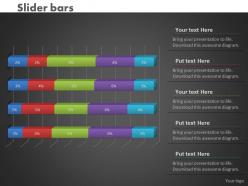 0414 slider bar chart for visual analysis powerpoint graph
We are proud to present our 0414 slider bar chart for visual analysis powerpoint graph. Our great team has conjured up a web of Slider Bar Chart For Visual Analysis Powerpoint Graph Powerpoint Templates. Use them to string together your glistening ideas. Think of it and be sure we have it. Our Slider Bar Chart For Visual Analysis Powerpoint Graph Powerpoint Templates offer you the widest possible range of options.
-
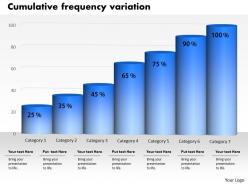
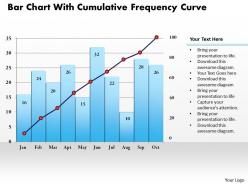 0414 bar chart with cumulative frequency curve powerpoint graph
Editing and upgrading of compiled data is simple in presentation visual. Presentation slide is helpful in business marketing, management and recourse disbursement. Principal work which can be altered with respect to font, color and layout. Appealing and impressive color contrast gives a professional look to PPT layout. Conversion into PDF or JPG formats is painless and user friendly. PPT graphic renders quality font size which can be read from a distance.
-
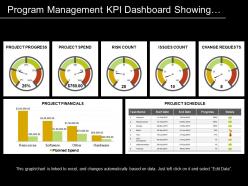 Program management kpi dashboard showing progress spend and risk count
Presenting this set of slides with name - Program Management Kpi Dashboard Showing Progress Spend And Risk Count. This is a three stage process. The stages in this process are Program Development, Human Resource Management, Program Management.
-
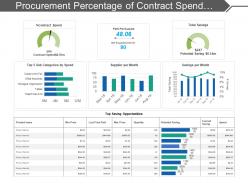 Procurement percentage of contract spend dashboard
Presenting this set of slides with name - Procurement Percentage Of Contract Spend Dashboard. This is a seven stage process. The stages in this process are Purchase, Procurement, Buy.
-
 Data driven bar graph powerpoint slides
We are proud to present our data driven bar graph powerpoint slides. Honors Your Audience With A Grand Parade Of Your Thoughts. Shower On Them The Confetti Of Our Data Driven Bar Graph Powerpoint Slides Power Point Templates. Set New Benchmarks With Our Data Driven Bar Graph Powerpoint Slides Power Point Templates. They Will Keep Your Prospects Well Above Par.
-
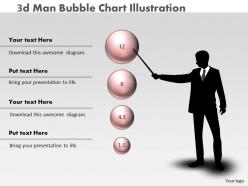 0414 3d man bubble chart illustration powerpoint graph
These PowerPoint design is adaptable with all software’s operations and all Google slides. These Presentation slides can also be simply exportable into PDF or JPG file schemes. These PPT images can be displayed in a larger screen ratio with an unaffected high resolution. All the aspects or features of these Presentation graphics like matter, pattern, context, intensity etc. can be manually manageable. They have a swift downloading process which saves times.
-
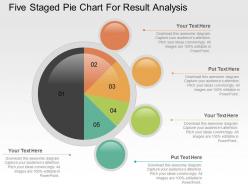 Five staged pie chart for result analysis powerpoint slides
Template slide pie chart is fully editable. Downloading template in any format choices like JPEG, JPG or PDF is easy and quick. Provide a specialist point of view to your template slides. Highly appreciable with Google slides. Symbols are in like manner being incorporated. Customization of text, graphics, designs, and content as showed by your longing and need. Visuals do not blur when opened on widescreen.
-
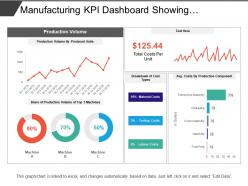 Manufacturing kpi dashboard showing production volume and cost breakdown
Presenting this set of slides with name - Manufacturing Kpi Dashboard Showing Production Volume And Cost Breakdown. This is a four stage process. The stages in this process are Manufacturing, Production, Manufacture.
-
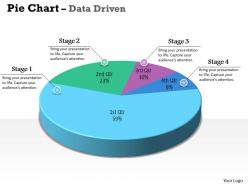 Data driven 3d pie chart for marketing process powerpoint slides
We are proud to present our data driven 3d pie chart for marketing process powerpoint slides. Timeline Crunches Are A Fact Of Life. Meet All Deadlines Using Our Data Driven 3D Pie Chart For Marketing Process Powerpoint Slides Power Point Templates. Connect The Dots Using Our Data Driven 3D Pie Chart For Marketing Process Powerpoint Slides Power Point Templates. Fan Expectations As The Whole Picture Emerges.
-
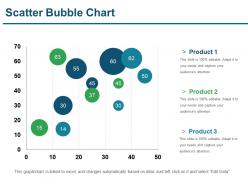 Scatter bubble chart presentation ideas
Presenting scatter bubble chart presentation ideas. This is a scatter bubble chart presentation ideas . This is a three stage process. The stages in this process are scatter bubble chart, finance, analysis, business, strategy.
-
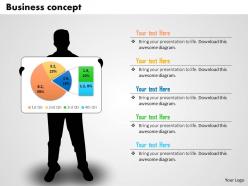 0514 highlight of result data driven pie chart powerpoint slides
We are proud to present our 0514 highlight of result data driven pie chart powerpoint slides. This Business Power Point template is designed with pie chart to highlight the result in any business presentation. Create a good impact on your viewers with our unique template collection.
-
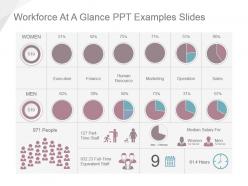 Workforce at a glance ppt examples slides
Presenting workforce at a glance ppt examples slides. This is a workforce at a glance ppt examples slides. This is a two stage. The Stages in this process are executive, finance, human resource, marketing, operation, sales, people, part time staff, median salary for, full time equivalent staff.
-
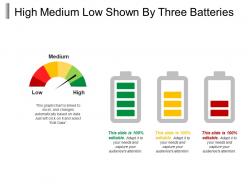 High medium low shown by three batteries
Presenting this set of slides with name - High Medium Low Shown By Three Batteries. This is a two stage process. The stages in this process are High Medium Low, High Moderate Low, Top Medium Low.
-
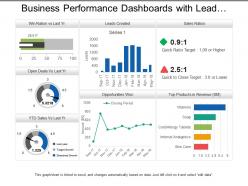 Business performance dashboards with lead creation and sales ratios
Presenting, business performance dashboards with lead creation and sales ratios for cost efficiency and performance indication PPT presentation. Bright and informative PowerPoint presentation slides. Gives regulations to achieve business success and targets. Produces error-free execution. Acts as a model for planning future assignments for marketing capabilities. Fully editable by any user at any point in time. Performs a clarity of marketing and presentation objectives without creating any confusions and misconceptions. Simple to be projected to widescreen without degradation in quality.
-
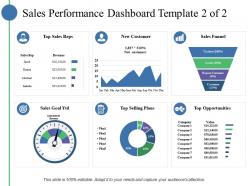 Sales performance dashboard top sales reps new customer
Introducing sales performance dashboard top sales reps new customer PowerPoint template. Presentation slides are crafted with high quality resolution designs. PPT templates comes in standard and widescreen view. Instant download and can be converted into other formats i.e. JPEG and PDF. Perfect for business management experts and research development team. Replace the watermark with your company’s logo. Possess time saving qualities. Presentation slides are well-matched with Google slides. Fast download and effortlessly inclusion in your presentation.
-
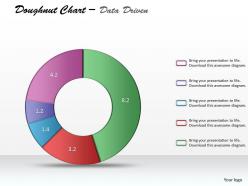 Data driven categorical statistics doughnut chart powerpoint slides
We are proud to present our data driven categorical statistics doughnut chart powerpoint slides. Our Data Driven Categorical Statistics Doughnut Chart Powerpoint slides Power Point Templates Give You That Extra Zing. Add Your Views And Make Your Audience Sing. Our Pretty Data Driven Categorical Statistics Doughnut Chart Powerpoint slides Power Point Templates Are Like Snowflakes That Fall. Gather Them Together And Have A Ball. Put Your Wondrously Glowing Ideas Into Them. Bind Them Together And Create Mayhem.
-
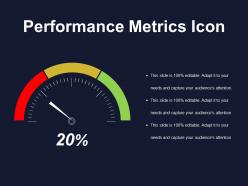 Performance metrics icon powerpoint images
Presenting performance metrics icon PowerPoint images PPT slide. This performance metrics slide is easily downloadable and export it into JPEG or PDF format. A presenter can display this performance metrics icon slide in the standard or widescreen view. You can even amend the color, text, font type & font size, aspect ratio, etc. of performance metrics icon slide. The performance metrics icon template gets 100% synced with Google Slides and fully editable in PowerPoint. You can share this performance metrics icon slide easily with large segment due to its tremendous pixel quality. The performance metrics icon slide gets linked with the excel sheet.
-
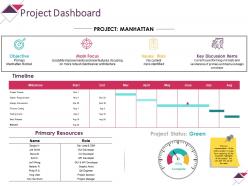 Project dashboard powerpoint slide influencers
Presenting this set of slides with name - Project Dashboard Powerpoint Slide Influencers. This is a four stage process. The stages in this process are Main Focus, Objective, Issues Risks, Key Discussion Items, Dashboard.
-
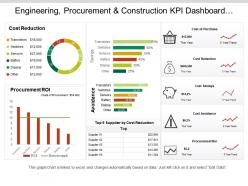 Engineering procurement and construction kpi dashboard showing cost of purchase order and cost reduction
You can use this PPT slideshow very easily as it is fully customizable. You can effortlessly insert or remove any diagrammatic representation from the given template. The font size, font color and font style can be easily edited. This graph PPT is linked to excel and changes automatically based on the data you enter. You can save the deck in either PDF or JPG format. To make any changes in the PPT slideshow, simply follow the instructions given in the sample slides. The size, color and orientation of all shapes are 100% customizable, so don’t waste any further time and download this presentation.
-
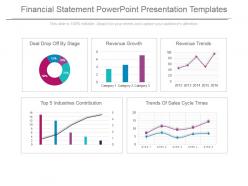 Financial statement powerpoint presentation templates
Stunning financial statement PowerPoint design. Fit to be used with Google slides. Replace the images, text and the content in the slide design. Change the size, style and orientation of the slides. Use your company’s name or brand name to make it your own presentation template. Beneficial for managers, professors, marketers, etc. Possess great quality for better understanding and error-free performance. Flexible option for conversion in PDF or JPG formats. Available in Widescreen format also. Useful for making business plan and strategies.
-
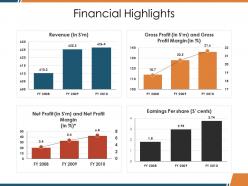 Financial highlights
Presenting this set of slides with name - Financial Highlights. This is a four stage process. The stages in this process are Earnings Per Share, Net Profit, Revenue, Gross Profit, Business.
-
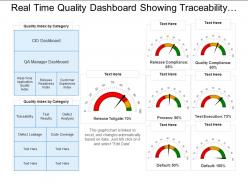 Real time quality dashboard showing traceability test results defects analysis
Presenting this set of slides with name - Real Time Quality Dashboard Showing Traceability Test Results Defects Analysis. This is a three stage process. The stages in this process are Quality Dashboard, Quality Kpi, Quality Metircs.
-
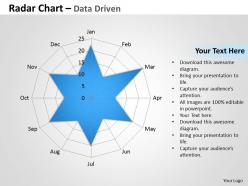 Data driven radar chart to compare data powerpoint slides
We are proud to present our data driven radar chart to compare data powerpoint slides. This PowerPoint Diagram shows data driven rader chart this makes the business reporting process that much easier and meaningful. You can offer the information you have researched to your boss in a much more efficient manner .
-
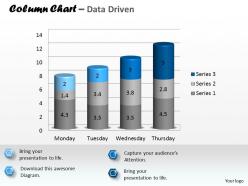 Data driven 3d column chart to represent information powerpoint slides
We are proud to present our data driven 3d column chart to represent information powerpoint slides. Our Data Driven 3D Column Chart To Represent Information Powerpoint Slides Power Point Templates Are The Strands Of Your Mental Loom. Weave Them Together And Produce A Magical Tapestry. Our Data Driven 3D Column Chart To Represent Information Powerpoint Slides Power Point Templates Provide Windows To Your Brilliant Mind. Open Them To Your Audience And Impress Them With Your Knowledge.


