

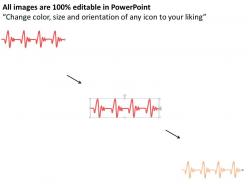
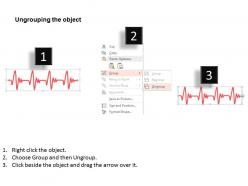
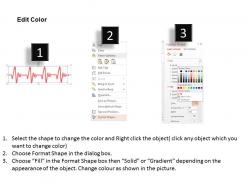
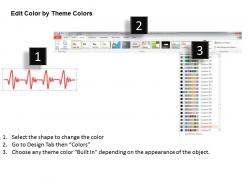
0115 red ecg diagram style timeline for achievement powerpoint template





Try Before you Buy Download Free Sample Product
 Impress Your
Audience
 100%
Editable
 Save Hours
of Time


Is it becoming very hard and time consuming task for you to compliment your thoughts with the best art graphic supported PPT slide? Our team of experts has made it possible to impress your clients in the business proposal using the red ECG diagram styled timeline for achievement of goals using PowerPoint Template. The PPT design is not only unique of its kind but also helps to keep a record or market progress report year thus it becomes easy to interface the past, present and future diagram on the same presentation slide. The PowerPoint presentation helps to achieve long term sustainable growth so that you think ahead rather than relying on day to day operations in isolation and ensures weaknesses are reversed for setting strategic planning objectives. In order to set an effective and elaborate roadmap for the growth of business, it’s important now days to compile information, resources and set of important objectives in PPT graphic.Complement your thoughts with our 0115 Red Ecg Diagram Style Timeline For Achievement Powerpoint Template. Together they will give out the whole picture.
People who downloaded this PowerPoint presentation also viewed the following :
0115 red ecg diagram style timeline for achievement powerpoint template with all 5 slides:
Let your thoughts cascade away. Gather them in our 0115 Red Ecg Diagram Style Timeline For Achievement Powerpoint Template pool.

FAQs for 0115 red ecg diagram style timeline for
Effective ECG timeline PowerPoint templates include clear cardiac rhythm displays, standardized grid measurements, customizable time intervals, professional medical formatting, and data annotation capabilities. These components streamline cardiac analysis presentations by enabling precise rhythm documentation, enhancing diagnostic communication, and facilitating patient case discussions, with many healthcare institutions finding that structured templates ultimately deliver faster consultations and improved clinical outcomes.
An ECG timeline PowerPoint template enhances medical presentations by providing structured visualization of cardiac events, standardized formatting for clinical data, and clear progression tracking of patient conditions over time. These templates streamline complex cardiac information presentation, enabling healthcare professionals in hospitals and medical conferences to communicate diagnostic findings, treatment progressions, and patient outcomes more effectively, ultimately delivering improved clinical communication and enhanced educational impact.
Essential design elements include clear time intervals, distinct waveform patterns, readable labels for P-QRS-T waves, consistent color coding, and sufficient white space for data interpretation. These elements enhance medical presentations by enabling healthcare professionals to effectively demonstrate cardiac rhythms, diagnostic findings, and treatment progressions, with many hospitals and medical institutions finding that well-designed templates significantly improve patient education and clinical communication outcomes.
Visuals in ECG PowerPoint templates significantly enhance audience retention by transforming complex cardiac data into digestible formats, utilizing clear waveform diagrams, color-coded annotations, and timeline progressions that simplify interpretation. These visual elements enable healthcare professionals, medical students, and clinical teams to grasp intricate cardiac rhythms more effectively, ultimately delivering improved comprehension and faster diagnostic learning outcomes.
Common mistakes include using overly complex medical terminology without explanations, cramming too much data onto single slides, using poor color contrast that makes ECG waves difficult to read, failing to maintain consistent time scales, and neglecting to provide clear interpretive context for non-medical audiences. These presentation pitfalls can confuse healthcare teams, reduce diagnostic clarity, and compromise patient care discussions, with many medical institutions finding that streamlined, well-designed ECG timelines enhance communication and ultimately deliver faster diagnoses and improved treatment outcomes.
Interactive elements in ECG timeline templates include clickable data points, hover-over details, animated progression sequences, expandable information panels, and embedded video explanations. These features enhance medical presentations by allowing healthcare professionals to explore patient data dynamically, demonstrate cardiac events interactively, and engage audiences more effectively, ultimately delivering clearer communication and improved educational outcomes.
Blue and green color schemes work best for ECG data presentations, offering optimal contrast and professional medical aesthetics, while red accents can highlight critical abnormalities or key diagnostic points. These strategic color combinations enhance data visualization by improving readability, maintaining clinical accuracy, and ensuring accessibility across diverse audiences, with many healthcare organizations finding that cooler tones ultimately deliver clearer patient communication and more effective medical presentations.
Custom ECG timeline templates can be tailored through technical depth, visual complexity, terminology usage, and data presentation approaches that match audience expertise levels. For medical professionals, templates incorporate detailed waveform analysis, diagnostic markers, and clinical terminology, while patient-focused versions emphasize simplified visuals, educational annotations, and clear progress indicators, ultimately delivering enhanced communication effectiveness across healthcare settings.
Different ECG waveforms influence timeline template design through rhythm patterns, amplitude variations, and diagnostic markers that guide visual hierarchy, color coding, and spacing decisions. Healthcare professionals creating patient education materials or medical presentations find that incorporating P-wave intervals, QRS complexes, and T-wave abnormalities into timeline structures enhances diagnostic clarity and educational impact.
High-quality ECG graphics for presentations can be sourced from medical template providers like SlideTeam, healthcare design platforms, stock image libraries with medical collections, and specialized cardiology resource databases. These platforms deliver professionally designed cardiac waveforms, anatomical illustrations, and diagnostic visualizations, with many healthcare institutions and medical educators finding that dedicated medical presentation libraries streamline content creation while maintaining clinical accuracy.
Practitioners can effectively communicate complex ECG data through timeline visuals by organizing cardiac events chronologically, highlighting critical intervals like P-R and QT segments, and using color coding to differentiate normal versus abnormal patterns. These visual approaches enable clearer patient consultations and educational presentations, with many cardiology departments finding that simplified timeline formats enhance patient understanding while streamlining clinical documentation processes.
Storytelling transforms ECG timeline presentations by creating narrative flow that connects cardiac events, patient outcomes, and clinical decisions into a cohesive journey. Through strategic sequencing, healthcare professionals can guide audiences through complex cardiovascular cases, highlight critical intervention points, and demonstrate treatment efficacy, ultimately enhancing medical education and patient communication while making technical cardiac data more accessible and memorable.
ECG timeline templates accommodate updates through modular, editable designs that allow healthcare professionals to modify intervals, add new diagnostic criteria, and incorporate emerging technologies seamlessly. These adaptable frameworks enable hospitals and clinics to update treatment protocols, integrate AI-enhanced analysis tools, and revise cardiac monitoring standards, ultimately ensuring compliance with evolving medical guidelines while maintaining consistent documentation across healthcare systems.
**INPUT**: What tips can enhance the usability of ECG timeline templates in educational settings? **OUTPUT**: Enhancing ECG timeline template usability involves using clear visual hierarchies, consistent color coding for different cardiac events, simplified medical terminology, and interactive elements that allow student engagement. Educational institutions find that incorporating real patient case studies, progressive complexity levels, and collaborative annotation features significantly improves comprehension rates, while enabling instructors to track learning outcomes and ultimately deliver more effective cardiovascular education experiences. **Word count: 60 words**
Incorporating patient case studies within ECG timeline templates enhances learning outcomes by contextualizing theoretical knowledge, enabling pattern recognition through real scenarios, and facilitating critical thinking development. Medical educators find that these integrated approaches streamline complex cardiac concepts, improve diagnostic accuracy, and ultimately deliver more engaged learners who retain information longer and apply skills more effectively in clinical practice.
-
Illustrative design with editable content. Exceptional value for money. Highly pleased with the product.
-
Very unique and reliable designs.