

0514 creative funnel diagram powerpoint presentation




Try Before you Buy Download Free Sample Product
 Impress Your
 Audience
 100%
100% Editable
 Save Hours
 of Time


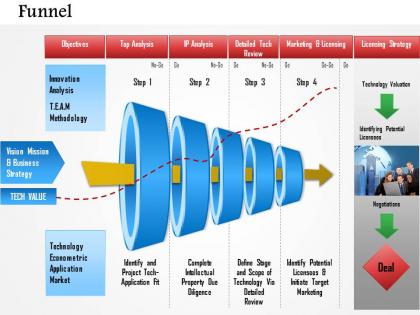
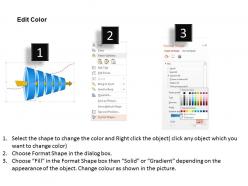
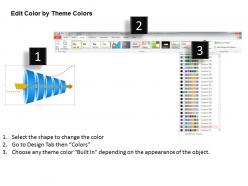
Have you ever wondered about going into a meeting and mesmerizing the audience with a spectacular display of your professional expertise as well as unique style? Then here’s the ultimate PowerPoint presentation with a vibrant and creative funnel diagram with which you can encompass multifaceted information on a project or plan in a single projection on the screen and win the hearts of your audience. The thrust of the vision and mission of the organization that guides the business strategy of every venture throughout the funnel of subsequent processes can be eloquently captured in this PowerPoint presentation slide. Represent the various steps such as top analysis, IP analysis, detailed technical review, marketing and licensing, licensing strategy, technology valuation, negotiations etc. that constitute the entire process till finalization of a deal with a customer, technological collaborator or business partner in this methodical PPT slide template to give a holistic picture to the key stakeholders in a visually appealing manner. Your thoughts have brought you a long way. Set course for the future with our 0514 Creative Funnel Diagram Powerpoint Presentation.
People who downloaded this PowerPoint presentation also viewed the following :
0514 creative funnel diagram powerpoint presentation with all 5 slides:
You are backing a deserving cause. Our 0514 Creative Funnel Diagram Powerpoint Presentation will provide yeoman service.
FAQs for 0514 creative funnel
A creative funnel diagram transforms traditional linear funnel presentations through innovative visual elements, dynamic color schemes, interactive components, 3D perspectives, and customized iconography that align with brand identity. Unlike conventional funnels that rely on basic geometric shapes, creative versions incorporate storytelling elements, animated transitions, and sector-specific imagery, with many organizations finding that these enhanced visualizations significantly improve audience engagement and data comprehension.
Creative funnel diagrams enhance business storytelling by visually mapping customer journeys, highlighting conversion bottlenecks, showcasing strategic decision flows, and illustrating progressive value propositions through compelling visual narratives. These diagrams enable presenters to transform complex data into engaging stories that resonate with stakeholders, ultimately delivering clearer insights and stronger business cases while maintaining audience engagement throughout presentations.
Key elements include clear stage progression, compelling visual hierarchy, measurable conversion metrics, audience-specific messaging, and strategic touchpoint mapping. These components work together by guiding prospects through awareness, consideration, and decision phases, with many marketing teams finding that well-designed funnels enhance campaign effectiveness, streamline customer journeys, and ultimately deliver higher conversion rates and improved ROI.
Color psychology significantly impacts creative funnel diagrams by influencing user emotions, attention flow, and decision-making through strategic hue selection, contrast optimization, and visual hierarchy creation. Through deliberate color choices, organizations enhance comprehension rates, guide prospect progression more effectively, and increase conversion outcomes, with many marketing teams finding that warm colors like orange and red accelerate urgency while cooler blues build trust throughout the customer journey.
Software tools for creating visually appealing creative funnel diagrams include Microsoft PowerPoint, Canva, Lucidchart, Adobe Illustrator, and Visio, each offering different design capabilities and customization options. These platforms streamline diagram creation through templates, drag-and-drop functionality, and professional graphics, with many marketing teams finding that PowerPoint and Canva deliver the best balance of ease-of-use and visual impact for presentations.
Creative funnel diagrams adapt across industries by modifying stages and metrics to reflect sector-specific processes, such as lead qualification and conversion in sales, student enrollment and progression in education, and patient acquisition and care delivery in healthcare. These visual frameworks streamline communication by translating complex workflows into easily understood stages, enabling organizations to identify bottlenecks, optimize resource allocation, and enhance operational efficiency while delivering improved customer experiences and measurable outcomes.
Icons and visuals enhance creative funnel diagrams by simplifying complex information, improving visual hierarchy, and creating immediate audience connection through recognizable symbols and imagery. These design elements streamline data comprehension, increase retention rates, and transform abstract concepts into tangible representations, with many organizations finding that well-designed visual funnels deliver significantly higher engagement and more effective stakeholder communication.
Creative funnel diagrams effectively summarize complex information by organizing data hierarchically from broad concepts at the top to specific details below, using visual elements like colors, icons, and progressive sizing to enhance comprehension. This approach enables organizations to streamline customer journey mapping, sales processes, and strategic planning presentations, ultimately delivering clearer stakeholder communication and faster decision-making across departments.
Common mistakes in creative funnel diagrams include overcrowding with excessive text, using inconsistent visual elements, misaligning stages with actual customer journey phases, and neglecting clear progression indicators. These design flaws significantly reduce diagram effectiveness, with many organizations finding that streamlined layouts, consistent color schemes, and logical stage sequences enhance stakeholder comprehension and strategic decision-making processes.
Creative funnel diagrams visually map each process stage, making bottlenecks immediately apparent through narrowed sections, data flow interruptions, and capacity constraints. By highlighting where prospects or resources get stuck, organizations can streamline operations, reallocate resources more effectively, and enhance overall efficiency, with many companies finding that visual process mapping reduces processing times and delivers significantly improved customer experiences.
Interactivity can be integrated through clickable funnel segments that reveal detailed metrics, hover effects showing conversion rates at each stage, animated transitions demonstrating customer flow, and embedded videos or case studies within funnel layers. These interactive elements enhance audience engagement by allowing presenters to drill down into specific data points, customize content based on audience questions, and create immersive storytelling experiences that transform static funnels into dynamic, exploratory tools for strategic discussions.
Success of presentations with creative funnel diagrams can be measured through audience engagement metrics, comprehension assessments, decision-making speed, and conversion rates at each funnel stage. Organizations increasingly find that these visual tools enhance stakeholder understanding by up to 40%, streamline complex process explanations, and accelerate project approvals, ultimately delivering clearer communication outcomes and faster consensus-building across teams.
Creative funnel diagrams excel in brainstorming sessions by visually organizing ideas from broad concept generation to focused solution selection, helping teams systematically narrow possibilities while maintaining creative flow. Facilitators use them to guide participants through divergent thinking phases into convergent decision-making, with many innovation teams finding that this structured approach enhances collaboration, prevents idea overload, and ultimately delivers more actionable outcomes than traditional brainstorming methods.
Recent design trends for creative funnel diagrams include gradient overlays, minimalist geometric shapes, interactive 3D elements, bold typography combinations, and micro-animations for digital presentations. These contemporary approaches enhance visual storytelling by creating depth, improving information hierarchy, and maintaining audience engagement, with many marketing teams finding that modernized funnels significantly boost presentation impact and stakeholder comprehension.
Stakeholder feedback enhances creative funnel diagrams by identifying unclear stages, revealing missing touchpoints, and validating conversion assumptions through real-world insights. Marketing teams, sales departments, and customer service representatives often provide critical perspectives on audience behavior, bottlenecks, and optimization opportunities, ultimately enabling more accurate targeting, streamlined processes, and improved conversion rates across the entire customer journey.
-
Content of slide is easy to understand and edit.
-
Out of the box and creative design.