

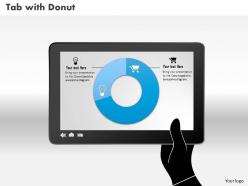
0514 data driven donut diagram powerpoint slides





Try Before you Buy Download Free Sample Product
 Impress Your
Audience
 100%
Editable
 Save Hours
of Time


The burden gets halved with our 0514 Data Driven Donut Diagram Powerpoint Slides. They always make a good contribution.
People who downloaded this PowerPoint presentation also viewed the following :
0514 data driven donut diagram powerpoint slides with all 3 slides:
Feel completely fulfilled with our 0514 Data Driven Donut Diagram Powerpoint Slides. You will experience a deep satisfaction.


FAQs for 0514 data driven donut
Data-driven donut diagrams offer enhanced readability, better space utilization for labels, reduced visual distortion, improved aesthetic appeal, and the ability to display additional information in the center space. These advantages make them particularly valuable for executive dashboards, financial reporting, and marketing analytics, with many organizations finding that the cleaner presentation enhances audience comprehension and engagement during strategic presentations.
Effective integration involves selecting visualization platforms like Tableau, Power BI, or D3.js that support customizable donut charts, ensuring clean data preparation through proper formatting and categorization, and implementing interactive features like hover effects and drill-down capabilities. These tools streamline chart creation by automating data connections, enabling real-time updates, and delivering enhanced user experiences, with many organizations finding that strategic integration ultimately accelerates decision-making processes.
Donut diagrams excel when displaying proportional relationships within hierarchical data, comparing part-to-whole ratios across categories, and presenting survey results with multiple response options. They prove particularly effective in financial dashboards showing budget allocations, healthcare analytics displaying patient demographics, and marketing reports illustrating customer segmentation, while the center space enables additional context like totals or key metrics.
Donut diagrams excel at visualizing categorical data that represents parts of a whole, including budget allocations, market share distributions, survey response breakdowns, demographic compositions, and resource utilization percentages. These diagrams work particularly well for financial services displaying portfolio allocations, healthcare organizations showing patient demographics, and retail companies illustrating sales categories, ultimately delivering clear proportional insights that enhance decision-making and stakeholder communication.
Donut diagram design significantly influences audience interpretation through strategic use of colors, spacing, proportions, and central messaging that guide visual hierarchy and data comprehension. Well-designed donut charts with clear contrast, appropriate sizing, and meaningful center text enhance engagement by making complex data accessible, while poor design choices can obscure insights, ultimately affecting decision-making effectiveness across business presentations.
**INPUT**: What software and tools are recommended for creating data-driven donut diagrams? **OUTPUT**: Recommended tools include Microsoft Excel, Google Sheets, Tableau, Power BI, and specialized presentation software like SlideTeam templates. These platforms streamline visualization by offering customizable templates, real-time data integration, and professional formatting options, with many organizations finding that combining multiple tools delivers enhanced flexibility and presentation quality. [Word count: 52 words]
Color psychology in donut diagrams involves using warm colors like red and orange for urgent data, cool blues and greens for stable metrics, and high-contrast combinations to highlight key segments. Strategic color choices enhance audience comprehension by creating emotional connections to data points, with many presenters finding that consistent color schemes across financial reports, marketing dashboards, and performance reviews ultimately improve stakeholder engagement and decision-making speed.
Common pitfalls when interpreting donut diagrams include misreading proportional relationships, overlooking the central space's potential for additional context, focusing on individual segments without considering the whole, and making assumptions about causation from correlation patterns. These visualization challenges can lead to strategic missteps in business presentations, with many organizations finding that combining donut diagrams with supplementary data tables enhances accuracy and delivers clearer insights for stakeholder decision-making.
Animations enhance data-driven donut diagrams by creating sequential reveals that guide audience attention, emphasizing key segments through dynamic highlighting, and enabling smooth transitions between different data sets or time periods. These animated elements help presenters control narrative flow, making complex proportional relationships more digestible, while the visual movement captures attention and improves retention, ultimately delivering more engaging and memorable presentations.
Labeling plays a crucial role in donut diagram clarity by providing direct identification of data segments, displaying precise values or percentages, and eliminating guesswork in data interpretation. Through strategic label placement and clear formatting, organizations streamline data comprehension, enhance stakeholder communication, and ultimately deliver more effective presentations, with many finding that well-labeled donut diagrams significantly improve decision-making processes.
Interactivity can be added to donut diagrams through hover effects revealing detailed data, clickable segments for drill-down analysis, animated transitions between datasets, and dynamic filtering options. These interactive features enhance user engagement by enabling exploration of complex data relationships, with many organizations in retail and financial services finding that interactive visualizations improve decision-making speed and stakeholder comprehension significantly.
Best practices for presenting complex data in donut diagrams include using clear labels, limiting categories to 5-7 segments, employing distinct colors, maintaining proportional accuracy, and adding contextual annotations. These visualization techniques enhance comprehension by reducing cognitive load, highlighting key relationships, and enabling quick pattern recognition, with many organizations finding that well-designed donut charts streamline decision-making processes and improve stakeholder engagement during data presentations.
Donut diagrams can be adapted for mobile and web presentations through responsive sizing, interactive hover effects, progressive disclosure of data layers, optimized color contrast for various screen types, and touch-friendly navigation elements. These adaptations enhance user engagement by enabling seamless data exploration across devices, with many organizations finding that mobile-optimized visualizations deliver improved accessibility and faster decision-making in increasingly digital business environments.
Data-driven donut diagrams excel at showing part-to-whole relationships and proportional breakdowns, while bar charts deliver superior performance for comparing discrete values and line graphs remain optimal for displaying trends over time. The effectiveness ultimately depends on your data story, with financial services using donut diagrams for portfolio allocations, bar charts for quarterly comparisons, and line graphs for performance tracking, ensuring audiences quickly grasp the intended insights.
To ensure donut diagram accessibility, implement clear color contrast ratios, descriptive alt text, keyboard navigation support, and screen reader compatibility through proper labeling and data tables. Organizations should also provide multiple format options like text summaries and tactile versions, with many financial services and healthcare institutions finding that these comprehensive accessibility measures significantly enhance audience engagement while ensuring regulatory compliance and inclusive data communication across diverse stakeholder groups.
-
Presentation Design is very nice, good work with the content as well.
-
Appreciate the research and its presentable format.