

1214 3d pie chart with arrows for data representation powerpoint slide





Try Before you Buy Download Free Sample Product
 Impress Your
Audience
 100%
Editable
 Save Hours
of Time


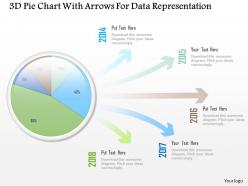
A pie chart presents data as a simple and easy-to-understand picture. Choose our pie chart with arrows for data representation PPT slide and impress your audience. 3D pie chart with arrows are used to craft this template slide. This visual contains the concept of data driven process flow and marketing data analysis. Use this PPT slide and build innovative presentation for your viewers. You can also manipulate pieces of data in the pie circle to emphasize points you want to make as the slide is completely amendable. The pie chart is one of the most common data visualization tools. Simple to create and understand, a pie chart works well when you need to present and measure simple data. It summarizes a large data set in visual form. The pie chart is perhaps the most universal statistical chart in the business world and the mass media which can easily be understood. So just download, insert and share our graphic whenever required to share with your audience. Acquire a bigger dimension with our 1214 3d Pie Chart With Arrows For Data Representation Powerpoint Slide. Function effectively on a broader canvas.
People who downloaded this PowerPoint presentation also viewed the following :
1214 3d pie chart with arrows for data representation powerpoint slide with all 3 slides:
Our 1214 3d Pie Chart With Arrows For Data Representation Powerpoint Slide ensure definite gains. Your coffers will begin to fill.


-
Professional and unique presentations.
-
I discovered this website through a google search, the services matched my needs perfectly and the pricing was very reasonable. I was thrilled with the product and the customer service. I will definitely use their slides again for my presentations and recommend them to other colleagues.