

1214 data driven pie chart inside the magnifier powerpoint slide





Try Before you Buy Download Free Sample Product
 Impress Your
Audience
 100%
Editable
 Save Hours
of Time


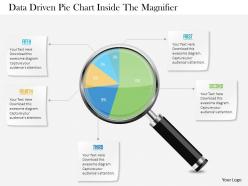
1214 data-driven pie chart inside the magnifier PowerPoint slide has a feel for the exotic. The Slide Graphic has been designed with the plan elaboration and fey factor focusing concept. The visuals show a magnifying glass on the pie chart split into five sections. This PPt template contains the notion of business data representation and marketing concepts. Use this picture template for business and administrators. Our team of specialists has made all possible efforts to come up with a plan which is structured, precise and well-articulated. So, what are you anticipating for? Be proactive to download and develop your presentation essentials beforehand to become the corporate leader of today. Altogether the ingredients used here consider in displaying that each of the stages is bound to work concurrently as a team. You will make exceptional discoveries. Good things happen with our 1214 Data Driven Pie Chart Inside The Magnifier Powerpoint Slide. The balance will tilt in your favor.
People who downloaded this PowerPoint presentation also viewed the following :
1214 data driven pie chart inside the magnifier powerpoint slide with all 3 slides:
Be the harbinger of change with our 1214 Data Driven Pie Chart Inside The Magnifier Powerpoint Slide. Get folks to accept and adapt enthusiastically.


FAQs for 1214 data driven pie chart inside the
Key principles of effective data visualization include clarity, simplicity, accuracy, relevance, and consistency in design elements. These principles work together by eliminating visual clutter, highlighting meaningful patterns, and ensuring data integrity, with organizations across sectors like healthcare, finance, and retail finding that well-designed visualizations accelerate decision-making and enhance stakeholder understanding.
Color theory enhances visual data readability by improving contrast ratios, creating logical hierarchies, and guiding viewer attention through strategic hue selection. Through systematic color application, organizations streamline information processing, reduce cognitive load, and enable faster decision-making, with many financial services and healthcare institutions finding that thoughtful color choices ultimately deliver clearer insights and improved analytical accuracy.
Interactive visualizations enhance user engagement by enabling personalized exploration, real-time filtering, drill-down capabilities, dynamic storytelling, and collaborative data discovery. These features transform passive viewers into active participants, with organizations across retail, healthcare, and financial services finding that interactive dashboards increase decision-making speed, improve data comprehension, and ultimately deliver more strategic insights and competitive advantage.
Common data visualization mistakes include overcrowding charts with excessive information, using misleading scales, choosing inappropriate chart types, neglecting color accessibility, and failing to provide clear context or labels. These errors significantly undermine decision-making accuracy across organizations, with many businesses finding that streamlined, purposeful visualizations enhance stakeholder understanding, accelerate strategic discussions, and ultimately deliver more confident data-driven outcomes.
Different chart types significantly influence data interpretation by guiding viewers toward specific patterns, trends, and insights through visual emphasis and cognitive processing pathways. Bar charts highlight comparisons, line graphs reveal trends over time, pie charts show proportions, and scatter plots expose correlations, with organizations finding that strategic chart selection enhances decision-making accuracy and stakeholder comprehension.
Storytelling transforms raw data into compelling narratives by structuring information logically, highlighting key insights, and creating emotional connections with audiences. Through strategic use of visual elements, annotations, and progressive disclosure, organizations can guide viewers through complex datasets, making findings more memorable and actionable, ultimately driving better decision-making and stakeholder engagement.
Cultural differences significantly affect data visualization through color symbolism, reading patterns, numerical formats, and aesthetic preferences that vary across regions. While red signifies danger in Western cultures but prosperity in Asian markets, designers must also consider right-to-left reading flows, comma versus period decimal notation, and cultural color associations, ultimately ensuring global accessibility and accurate data interpretation across diverse audiences.
Professional data visualization tools include Tableau, Power BI, D3.js, Qlik Sense, and Python libraries like Matplotlib and Seaborn. These platforms streamline complex data interpretation by offering intuitive drag-and-drop interfaces, advanced analytics capabilities, and seamless integration with existing databases, ultimately enabling organizations to transform raw information into compelling visual narratives that drive strategic decision-making.
Ensuring accessibility in data visualizations involves using colorblind-friendly palettes, providing alternative text descriptions, incorporating multiple encoding methods like patterns and shapes, and designing clear hierarchies with sufficient contrast ratios. These approaches enable organizations across sectors like healthcare, finance, and government to reach broader audiences while delivering more inclusive insights, ultimately enhancing user engagement and regulatory compliance.
**INPUT**: What metrics should be used to assess the effectiveness of a visualization? **OUTPUT**: Effectiveness metrics include comprehension accuracy, task completion time, user engagement rates, error frequency, and recall retention scores. These assessment approaches enable organizations to optimize dashboard performance, enhance decision-making speed, and streamline analytical workflows, with many financial services and healthcare institutions finding that comprehensive evaluation ultimately delivers improved operational efficiency and strategic insights.
Data visualization techniques enhance business decision-making by transforming complex datasets into intuitive charts, dashboards, and interactive reports that reveal patterns, trends, and actionable insights. Through strategic visual analytics, organizations streamline performance monitoring, accelerate market analysis, and improve stakeholder communication, with many executives finding that visual data presentations enable faster, more confident strategic decisions and competitive advantage.
Data visualization significantly impacts data integrity through transformation processes, aggregation methods, visual encoding choices, and interpretation frameworks that can introduce bias or misrepresentation. While effective visualizations enhance accuracy by revealing patterns and anomalies, they also present challenges in maintaining source data fidelity, with many organizations finding that robust validation protocols and transparent methodologies ultimately deliver more reliable insights and informed decision-making across business operations.
Balancing aesthetics and functionality requires prioritizing clear data communication while incorporating visually appealing design elements like consistent color schemes, readable fonts, and logical layouts. Effective visuals combine compelling storytelling with accurate representation, ensuring that visual enhancements support rather than distract from key insights, ultimately delivering both engagement and comprehension for decision-makers.
Infographics offer enhanced visual appeal, improved information retention, faster comprehension, simplified complex data presentation, and increased audience engagement compared to traditional reports. These visual formats streamline communication by transforming dense statistics into digestible graphics, with marketing teams, healthcare organizations, and educational institutions finding that infographics boost stakeholder understanding and decision-making speed significantly.
AI and AR revolutionize data visualization by enabling automated insight generation, predictive analytics, and immersive three-dimensional data experiences. Through machine learning algorithms and augmented reality interfaces, organizations streamline complex data interpretation, enhance real-time decision-making, and deliver interactive visualizations, with sectors like healthcare, finance, and manufacturing finding these technologies ultimately provide competitive advantages and faster strategic responses.
-
Best Representation of topics, really appreciable.
-
Nice and innovative design.