

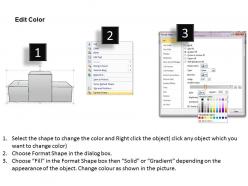
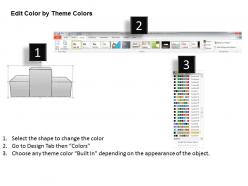
2502 business ppt diagram winners podium with rank 123 powerpoint template





Try Before you Buy Download Free Sample Product
 Impress Your
Audience
 100%
Editable
 Save Hours
of Time


Be the beau of the ball with our 2502 Business Ppt Diagram Winners Podium With Rank 123 Powerpoint Template. Folks will take a fancy to you.
People who downloaded this PowerPoint presentation also viewed the following :
2502 business ppt diagram winners podium with rank 123 powerpoint template with all 5 slides:
Our 2502 Business Ppt Diagram Winners Podium With Rank 123 Powerpoint Template make the audience forgiving. They will overlook minor errors.


FAQs for 2502 business ppt diagram winners podium with rank
Key elements for impactful business PPT diagrams include clear hierarchical structure, consistent visual formatting, strategic color coding, concise labeling, and logical flow indicators. These components streamline complex information by eliminating visual clutter, enhancing audience comprehension, and maintaining professional credibility, with many organizations finding that well-structured diagrams accelerate decision-making and improve stakeholder engagement.
Color psychology in business PPT diagrams enhances audience engagement by triggering emotional responses, improving information retention, and guiding visual attention to key data points. Strategic color choices, such as blue for trust in financial presentations or green for growth metrics, enable presenters to reinforce messaging subconsciously, while creating memorable visual experiences that drive better decision-making outcomes.
The most effective diagrams for market analysis include market share pie charts, competitive positioning matrices, trend line graphs, SWOT analysis frameworks, and customer segmentation charts. These visual tools streamline complex data interpretation by highlighting key insights, comparing competitive landscapes, and demonstrating growth opportunities, with many organizations finding that strategic diagram selection ultimately enhances stakeholder understanding and accelerates decision-making processes.
Infographics enhance business PPT diagrams by transforming dense datasets into visual narratives through charts, icons, flowcharts, and data visualizations that highlight key insights instantly. These visual elements streamline stakeholder communication by reducing cognitive load, accelerating decision-making processes, and improving information retention, with many organizations finding that strategic infographic integration ultimately delivers more persuasive presentations and enhanced audience engagement.
Best practices for business PPT diagram typography include selecting professional sans-serif fonts like Arial or Calibri, maintaining consistent font sizes with hierarchical scaling, limiting font varieties to two maximum, ensuring high contrast ratios, and using adequate white space. These typography principles enhance readability, maintain visual consistency, and project professionalism across presentations, with many organizations finding that strategic font choices significantly improve audience comprehension and engagement.
Different diagram types serve distinct business communication needs: flowcharts visualize processes and workflows, pie charts display proportional data and market shares, timelines track project milestones and strategic roadmaps, while organizational charts clarify hierarchies and reporting structures. These visual tools enhance stakeholder understanding by transforming complex information into digestible formats, ultimately streamlining decision-making processes and improving presentation effectiveness across departments.
Icons and visuals enhance business PPT diagrams by improving comprehension, reducing cognitive load, and creating memorable visual anchors that audiences can quickly process and retain. These elements streamline complex information delivery, enable faster decision-making during presentations, and boost audience engagement, with many organizations finding that well-designed visual diagrams significantly improve stakeholder buy-in and strategic communication outcomes.
Business PPT diagrams for remote presentations should prioritize bold, high-contrast visuals, larger fonts, simplified layouts, and interactive elements like clickable sections or animated reveals. These design principles enhance screen readability and combat virtual meeting fatigue, with many organizations finding that strategic use of whitespace, consistent color schemes, and progressive disclosure techniques significantly boost audience engagement and message retention during digital presentations.
**INPUT**: What software tools or platforms are recommended for creating high-quality business PPT diagrams? **OUTPUT**: Recommended platforms include Microsoft PowerPoint, Canva, Lucidchart, Visio, and specialized template providers like SlideTeam. These tools streamline diagram creation by offering pre-built templates, drag-and-drop functionality, and professional design elements, with many organizations finding that strategic template investments significantly reduce preparation time while enhancing presentation quality and visual impact. **Word count: 55 words**
Data visualization techniques enhance business PPT storytelling by transforming complex data into compelling narratives through interactive charts, infographics, heat maps, and dynamic graphs that guide audience attention. These visual elements streamline information delivery while creating emotional connections, with many organizations finding that strategic data presentation increases stakeholder engagement, accelerates decision-making processes, and ultimately delivers more persuasive presentations that drive actionable business outcomes.
**INPUT**: What strategies can be employed to maintain a professional aesthetic in business PPT diagrams? **OUTPUT**: Professional business PPT diagrams require consistent color schemes, clean typography, balanced whitespace, standardized iconography, and strategic alignment throughout presentations. These design principles enhance credibility by eliminating visual clutter, improving information hierarchy, and ensuring seamless brand consistency, with many organizations finding that well-designed diagrams significantly improve stakeholder engagement and decision-making outcomes.
Businesses ensure PPT diagram alignment through consistent color schemes, typography, and visual elements that reflect their brand identity, messaging hierarchy, and core values. Strategic template development enables teams to maintain uniform presentation standards across departments, while incorporating company logos, brand colors, and messaging frameworks ultimately delivers cohesive communications that reinforce brand recognition and professional credibility.
Business PPT templates should include customizable data visualization charts, interactive navigation elements, animation-ready slide transitions, modular content blocks, and consistent brand integration capabilities. These features streamline presentation development by enabling real-time data updates, seamless audience engagement, and professional visual consistency, with many organizations finding that dynamic templates reduce preparation time while enhancing stakeholder communication effectiveness.
Stakeholder feedback can be integrated through iterative design reviews, version control systems, collaborative platforms like SharePoint or Teams, and structured feedback collection templates. These approaches streamline revisions by capturing specific input on visual clarity, data accuracy, and messaging alignment, with many organizations finding that early stakeholder involvement reduces revision cycles and ultimately delivers presentations that resonate more effectively with target audiences.
Current presentation design trends influencing business PPT diagrams include minimalist layouts, data storytelling approaches, interactive elements, mobile-responsive formatting, and AI-enhanced visual automation. These design innovations streamline complex information delivery by emphasizing clarity over decoration, integrating dynamic content capabilities, and enabling seamless cross-platform accessibility, with many organizations finding that modern diagram aesthetics significantly enhance audience engagement and decision-making speed.
-
Illustrative design with editable content. Exceptional value for money. Highly pleased with the product.
-
Great product with highly impressive and engaging designs.