


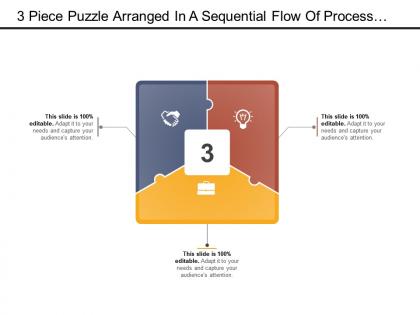
3 piece puzzle arranged in a sequential flow of process with icon
You must be logged in to download this presentation.




Try Before you Buy Download Free Sample Product
 Impress Your
 Audience
 100%
100% Editable
 Save Hours
 of Time


Get entrenched with our 3 Piece Puzzle Arranged In A Sequential Flow Of Process With Icon. Dig deep into the foundation of each aspect.
People who downloaded this PowerPoint presentation also viewed the following :
3 piece puzzle arranged in a sequential flow of process with icon with all 5 slides:
Bolster your drive for globalization. Our 3 Piece Puzzle Arranged In A Sequential Flow Of Process With Icon know no borders.
FAQs for 3 piece puzzle arranged in a sequential flow of
Key components of process flow diagrams include start/end points, process steps, decision points, connectors, and data flows. These elements facilitate understanding by visually mapping workflows, eliminating ambiguity in complex procedures, and enabling teams to identify bottlenecks, redundancies, and optimization opportunities, ultimately streamlining operations and enhancing communication across departments.
Process flow diagrams enhance team communication by providing visual clarity, standardizing terminology, identifying handoff points, and creating shared understanding of workflows. These visual tools streamline collaboration by eliminating ambiguity, reducing miscommunication, and ensuring alignment across departments, with many project teams finding that standardized process maps ultimately deliver faster execution and improved coordination.
Process flow diagrams excel when mapping sequential operations, decision points, and workflow dependencies across departments or systems. They're particularly valuable for business process reengineering, quality management initiatives, and operational audits in manufacturing, healthcare, and financial services, where organizations need to identify bottlenecks, standardize procedures, and ensure compliance requirements are met throughout complex workflows.
Popular software tools for creating process flow diagrams include Microsoft Visio, Lucidchart, Draw.io, SmartDraw, and Creately, along with presentation platforms like PowerPoint and Google Drawings. These tools streamline diagram creation by offering pre-built templates, drag-and-drop functionality, and collaborative features, with many organizations finding that cloud-based solutions enhance team coordination and real-time process documentation.
Process flow diagrams remain clear by using consistent symbols, logical layouts, minimal text labels, appropriate spacing, and color coding for different process types. These design principles streamline comprehension by reducing visual noise, creating intuitive pathways, and highlighting critical decision points, with many organizations finding that well-structured diagrams enhance team collaboration and operational efficiency.
Common pitfalls include overcomplicated designs, unclear decision points, missing exception handling, inconsistent symbols, and lack of stakeholder input during creation. These mistakes often result from rushing the design phase, with many organizations finding that involving cross-functional teams and following standardized notation ultimately delivers clearer workflows and better process adoption across departments.
Process flow diagrams vary significantly across industries due to different operational requirements, regulatory standards, and outcome priorities. Healthcare diagrams emphasize patient safety protocols, compliance checkpoints, and clinical decision trees, while manufacturing focuses on production efficiency, quality control gates, and resource optimization, with each sector tailoring workflows to deliver improved patient outcomes or streamlined production efficiency respectively.
Color-coding enhances process flow diagrams by improving visual clarity, reducing interpretation time, and enabling quick identification of different process elements, decision points, and workflow stages. Through strategic color application, teams can instantly distinguish between departments, priority levels, and process types, with many organizations finding that color-coded diagrams streamline training, accelerate troubleshooting, and enhance cross-functional collaboration.
Process flow diagrams can be adapted for remote collaboration through cloud-based diagramming tools, real-time editing capabilities, video integration for discussions, and shared digital workspaces with version control. These technologies streamline remote workflow mapping by enabling simultaneous editing, instant feedback, and centralized documentation, with many distributed teams finding that visual process collaboration ultimately enhances project clarity and accelerates decision-making across time zones.
Best practices for presenting process flow diagrams include using clear visual hierarchy, consistent symbols and colors, logical flow direction, and minimal text with actionable labels. Successful presentations in manufacturing, healthcare, and financial services focus on highlighting decision points, bottlenecks, and improvement opportunities, while encouraging stakeholder interaction through guided walkthroughs that connect process steps to measurable business outcomes and efficiency gains.
Process flow diagrams should be updated whenever significant changes occur in business operations, typically quarterly during regular reviews, or immediately following process modifications, system implementations, or regulatory changes. Organizations increasingly find that maintaining current diagrams through scheduled audits and real-time updates enables better operational efficiency, reduces training time, and ensures compliance accuracy across departments.
Swimlane diagrams enhance process transparency by clearly delineating roles, responsibilities, and handoff points across departments, teams, and stakeholders within complex workflows. This visual approach streamlines accountability, reduces confusion in cross-functional processes, and enables organizations to identify bottlenecks, redundancies, and gaps, ultimately delivering improved operational efficiency and faster process execution.
Embedding data analytics within process flow diagrams enhances business decision-making by providing real-time performance metrics, identifying bottlenecks through predictive insights, and enabling data-driven optimization at each workflow stage. These integrated dashboards streamline operational efficiency by highlighting inefficiencies, automating resource allocation, and delivering actionable intelligence, with many organizations finding that enhanced visibility ultimately accelerates strategic responses and competitive advantage.
**INPUT**: What are some case studies that illustrate the successful implementation of process flow diagrams? **OUTPUT**: Successful process flow diagram implementations include Toyota's lean manufacturing optimization, Mayo Clinic's patient care pathway streamlining, and Amazon's warehouse automation processes. These organizations enhanced operational efficiency, reduced bottlenecks, and minimized errors by up to 40%, with many finding that visual process mapping ultimately delivers faster service delivery and significant cost reductions. **Word count**: 54 words
Future process improvements can be integrated into existing process flow diagrams through version control systems, modular design structures, and stakeholder feedback loops that enable seamless updates. Organizations in manufacturing, healthcare, and financial services find that maintaining flexible diagram frameworks with standardized symbols and digital collaboration tools allows for continuous optimization while preserving operational clarity and ensuring team alignment.
-
Very well designed and informative templates.
-
Informative presentations that are easily editable.