

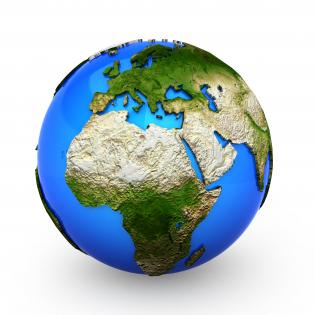
3d colored globe graphic stock photo




Try Before you Buy Download Free Sample Product
 Impress Your
Audience
 100%
Editable
 Save Hours
of Time


Become a corporate guru with our 3D Colored Globe Graphic Stock Photo. They will crave for your blessings.
People who downloaded this PowerPoint presentation also viewed the following :
3d colored globe graphic stock photo with all 1 slides:
Endless design choices at hand. Choose one of our 3D Colored Globe Graphic Stock Photo designs to freshen up your next presentation.

FAQs for 3d colored globe
3D globes in presentations offer enhanced spatial understanding, improved audience engagement, accurate geographic proportions, dynamic rotation capabilities, and sophisticated visual impact compared to flat maps. These interactive elements streamline complex geographical concepts by eliminating distortion, enabling comprehensive perspective shifts, and creating memorable visual experiences, with many organizations finding that three-dimensional representations ultimately deliver stronger audience retention and more compelling storytelling for global business strategies.
A 3D globe enhances audience engagement by providing interactive visual exploration, real-time data visualization, and immersive geographical storytelling that transforms abstract concepts into tangible experiences. Through dynamic rotation, layered environmental data, and clickable regions, organizations deliver more compelling presentations, facilitate deeper understanding of global issues, and create memorable learning experiences that drive stronger audience participation and retention.
**INPUT**: What software tools are most effective for creating interactive 3D globe presentations? **OUTPUT**: Effective tools for interactive 3D globe presentations include Unity, Blender, Three.js, Google Earth Studio, and specialized platforms like ArcGIS Online. These technologies streamline global data visualization by enabling real-time interaction, seamless data integration, and cross-platform compatibility, with many organizations finding that interactive globes enhance stakeholder engagement and strategic decision-making.
A 3D globe effectively visualizes climate change data through temperature mapping, sea level projections, deforestation tracking, polar ice coverage, and atmospheric circulation patterns. These interactive visualizations enable environmental scientists, policymakers, and educational institutions to present complex climate trends spatially, ultimately delivering enhanced understanding and more informed decision-making for climate adaptation strategies.
Educators can integrate 3D globes by incorporating interactive mapping exercises, virtual field trips, cross-curricular geography lessons, spatial reasoning activities, and collaborative exploration projects. Through digital platforms and hands-on manipulation, teachers enhance student engagement, improve spatial understanding, and connect abstract geographical concepts to real-world contexts, with many schools finding that tactile learning significantly improves retention and comprehension rates.
Best practices for animating a 3D globe include using smooth rotational transitions, highlighting specific regions with zoom effects, synchronizing animations with narrative flow, maintaining consistent rotation speeds, and incorporating strategic pauses for emphasis. These techniques enhance audience engagement by creating visual focal points, reducing cognitive overload, and delivering geographic data more effectively, with many presenters finding that purposeful globe animations significantly improve information retention and audience comprehension.
Businesses can use 3D globes to visualize market penetration, supply chain networks, trade flows, regional performance data, and logistics routes across multiple continents simultaneously. Through interactive globe presentations, companies in manufacturing, retail, and logistics can demonstrate market expansion strategies, shipping optimization, and global partnerships, ultimately delivering clearer stakeholder understanding and more compelling strategic communications.
**INPUT**: What are the technical requirements for embedding a 3D globe in a PowerPoint presentation? **OUTPUT**: Technical requirements include PowerPoint 2016 or newer, sufficient RAM (minimum 4GB recommended), updated graphics drivers, compatible file formats like OBJ or GLB, and stable processor performance. These specifications enable smooth 3D rendering, seamless rotation capabilities, and interactive functionality, with many organizations finding that proper system optimization ultimately delivers engaging presentations and enhanced audience experiences across corporate training and client demonstrations.
3D globes enhance historical and cultural storytelling by providing spatial context, visual anchors for geographic connections, and immersive reference points that make abstract concepts tangible. Through interactive elements and layered information displays, presenters can guide audiences through historical migrations, cultural exchanges, and regional developments, ultimately creating more engaging narratives that help audiences visualize complex relationships across time and geography.
3D globes deliver significant impact across education, urban planning, meteorology, logistics, and tourism sectors. In educational institutions, they enhance geographic learning through interactive visualization, while meteorologists use them for weather pattern analysis, shipping companies optimize global routes, and tourism operators create immersive destination experiences, ultimately streamlining complex spatial understanding and strategic decision-making across industries.
Creating accurate 3D globes presents challenges including geographical precision, data visualization complexity, rendering performance, scale representation, and interactive functionality requirements. These technical hurdles require balancing visual appeal with informational accuracy, while ensuring smooth performance across different presentation platforms, with many organizations finding that strategic design choices between detail and clarity ultimately deliver more impactful audience engagement.
3D globes enhance remote team collaboration by providing interactive visual references for global projects, enabling real-time data visualization across geographic regions, and facilitating spatial understanding of worldwide operations. Through virtual meeting platforms, teams can manipulate shared 3D globe models to discuss market expansion, supply chain logistics, and international partnerships, ultimately delivering more engaging presentations and clearer strategic communication than traditional flat maps.
Case studies showcasing successful 3D globes include McKinsey's global expansion strategies, Deloitte's international market analysis presentations, and IBM's worldwide client distribution reports. These professional presentations enhance audience engagement by visualizing complex geographical data, enabling clearer communication of global reach and market penetration, with many consulting firms finding that interactive globes significantly improve client comprehension and decision-making processes.
Technology has revolutionized 3D globe presentations through interactive mapping software, real-time data visualization, augmented reality integration, and cloud-based collaboration platforms. These innovations enable presenters to display live demographic trends, climate patterns, and market analytics seamlessly, with many organizations finding that interactive 3D globes enhance audience engagement and deliver more compelling, data-driven storytelling.
Future trends in 3D globe usage include enhanced interactivity through touch and gesture controls, real-time data integration, augmented reality overlays, AI-powered analytics visualization, and cloud-based collaborative features. These advancements enable organizations to deliver more engaging presentations, streamline complex global data storytelling, and enhance audience comprehension, with many companies finding that interactive 3D globes significantly improve stakeholder engagement and decision-making processes.
-
Editable templates with innovative design and color combination.
-
Excellent template with unique design.