

4 arrow shows percentage increase powerpoint slides





Try Before you Buy Download Free Sample Product
 Impress Your
Audience
 100%
Editable
 Save Hours
of Time


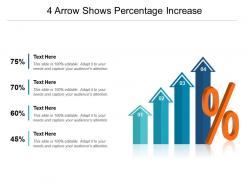
Select our 4 arrow shows percentage increase PowerPoint slides to present information about your business growth. This creative and innovative bar graph PPT design helps you to deliver a statement about the profit earned in the last quarter or year. The presentation template has been created for you to engage your investors, shareholders, board of directors to invest in your ideas. In this competitive world, it is quite hard to convince someone to believe in your capability, the best way to show your talent is to show the numbers achieved. With this PowerPoint layout, you can highlight that you have achieved numbers previously and will ensure to meet them in the future as well. Besides this, you can also use this presentation visual to share details about business numbers with your teammates and appreciate their effort in taking business to the next level. Moreover, educational institutes can also make best use of this PPT sample as they can use it to communicate details about the growth concept. Download it now. Formulate an equitable agreement with our 4 Arrow Shows Percentage Increase Powerpoint Slides. Insert elements that foster accord.
People who downloaded this PowerPoint presentation also viewed the following :
4 arrow shows percentage increase powerpoint slides with all 5 slides:
Our 4 Arrow Shows Percentage Increase Powerpoint Slides will arm you with factual data. You can go beyond gut feelings.


FAQs for 4 arrow shows percentage
The percentage increase formula is: ((New Value - Original Value) / Original Value) × 100. This calculation enables businesses to measure growth across key metrics like revenue, customer acquisition, and operational efficiency, with many organizations finding that tracking percentage increases helps identify trends, benchmark performance against competitors, and make data-driven strategic decisions for sustained growth.
Percentage increase enables businesses to project budget growth across departments, revenue streams, and operational costs by applying historical growth rates to baseline figures. Financial teams use these calculations to forecast quarterly sales targets, anticipate workforce expansion costs, and model scenario planning, ultimately delivering more accurate budget allocations and strategic resource planning in competitive markets.
Percentage increase enables sales teams to measure growth momentum by comparing current performance against previous periods, identifying trending patterns, and assessing territory effectiveness across different market conditions. Through percentage-based analysis, organizations can benchmark individual representatives, evaluate seasonal fluctuations, and allocate resources strategically, ultimately delivering clearer performance insights and competitive advantage in sales planning.
Understanding percentage increase enables investors to evaluate returns, compare investment performance across different assets, and assess risk-to-reward ratios effectively. Through percentage analysis, financial advisors and portfolio managers can identify growth trends, benchmark mutual funds against market indices, and make data-driven decisions that ultimately deliver optimized returns and strategic portfolio diversification.
Common misconceptions about percentage increase calculations include confusing percentage points with percentages, calculating increases from the wrong base value, assuming symmetrical increases and decreases, and misinterpreting compound versus simple growth rates. These errors frequently impact financial forecasting, sales projections, and performance analytics across retail and manufacturing sectors, with many organizations finding that standardized calculation protocols significantly enhance reporting accuracy and strategic decision-making.
Percentage increase measures proportional growth relative to the original value, while absolute increase represents the raw numerical difference between two values. For instance, a $10 increase on a $100 investment represents 10% growth, whereas the same $10 increase on a $1,000 investment yields only 1%, demonstrating how percentage calculations provide standardized comparisons across different scales and enable strategic performance benchmarking.
Percentage increase proves more beneficial when comparing changes across different scales, time periods, or baseline values, as it provides standardized context that raw figures cannot deliver. Organizations use percentages when analyzing growth rates across varying departments, tracking performance improvements over different quarters, or presenting scalable insights to stakeholders, ultimately enabling clearer decision-making and strategic comparisons.
Percentage increase directly influences consumer pricing strategies by enabling businesses to communicate value transparently, justify premium positioning, and maintain competitive margins while managing customer expectations. Through strategic percentage-based adjustments, retailers can implement gradual price escalations, seasonal promotions, and tiered pricing models, with many finding that transparent percentage frameworks enhance customer trust and purchasing decisions, ultimately delivering sustainable revenue growth.
Excel, Google Sheets, QuickBooks, Tableau, and specialized financial calculators streamline percentage increase calculations through automated formulas, real-time data integration, and customizable templates. These tools enhance accuracy and efficiency across finance, sales, and analytics departments, with many organizations finding that automated calculations reduce errors while delivering faster reporting and strategic insights.
Percentage increase can be visualized effectively through bar charts, line graphs, waterfall charts, before-and-after comparisons, and arrow diagrams with clear numerical callouts. These visualization methods enhance audience comprehension by transforming abstract numerical data into compelling visual narratives, with many presenters finding that combining multiple chart types with consistent color coding delivers maximum impact and retention.
A high percentage increase in competitive markets typically signals strong demand, innovation adoption, or market expansion opportunities, while also attracting new competitors and potentially raising customer expectations. Companies experiencing such growth must balance scaling operations efficiently with maintaining service quality, as competitors will likely intensify their efforts to capture market share, ultimately requiring strategic reinvestment to sustain competitive advantage.
Negative percentage increases in financial reports indicate actual decreases and should be clearly labeled as "percentage decreases" or "declines" to avoid confusion among stakeholders. These figures represent declining revenues, reduced margins, or shrinking market positions, requiring immediate strategic attention from management, with many organizations finding that transparent reporting of negative trends enables faster corrective action and maintains investor confidence.
Percentage increases can be misleading when applied to small base numbers, during short timeframes, or without proper context about absolute values and market conditions. Caution should be exercised in financial reporting, performance metrics, and trend analysis, where organizations increasingly recognize that combining percentage data with absolute figures and benchmarking delivers more accurate insights and strategic decision-making capabilities.
Inflation rates significantly impact percentage increases in income by eroding purchasing power, meaning a 5% income increase during 4% inflation delivers only 1% real growth. Financial analysts and HR departments increasingly adjust compensation evaluations for inflation, with many organizations finding that nominal percentage gains can mask declining living standards, ultimately requiring inflation-adjusted calculations for accurate economic interpretation.
Methods for tracking percentage increases across multiple periods include comparative analysis, trend charting, rolling averages, compound annual growth rate calculations, and period-over-period variance reporting. These approaches enable organizations to identify growth patterns, seasonal fluctuations, and performance trajectories, with many businesses finding that consistent tracking across quarters and years delivers strategic insights for forecasting and competitive positioning.
-
Easily Editable.
-
Innovative and Colorful designs.