


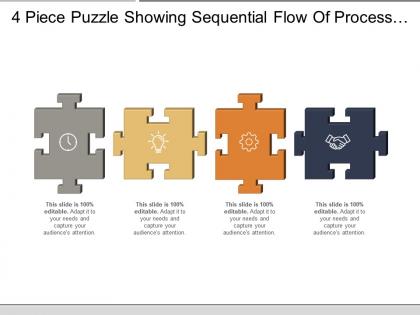
4 piece puzzle showing sequential flow of process with respective icon
You must be logged in to download this presentation.




Try Before you Buy Download Free Sample Product
 Impress Your
 Audience
 100%
100% Editable
 Save Hours
 of Time


Download our 4 piece puzzle showing sequential flow of process with respective icon PowerPoint slide to show information of a process in sequential order. This presentation slide of process flow chart has been created by our professional team and allows you to draw the boundaries of your process such as starting point of the process and where it ends. This jigsaw puzzle showing process flow of business PPT slide is helpful you to visualize sequence of actions in a process, materials or services entering or leaving the process and to measure the time involved at each step action is performed. This layout can be used to communicate with others as to how an operation is performed, to study process sequence for improvement and assist in creating a graphical representation of various steps to reveal opportunities for improvement. With the help of this flowchart template with icons slideshow you can define the scope of each activity, so that information statement can provide description of design. Avoid irksome interruptions with our 4 Piece Puzzle Showing Sequential Flow Of Process With Respective Icon. Bring an end to feelings of annoyance.
People who downloaded this PowerPoint presentation also viewed the following :
4 piece puzzle showing sequential flow of process with respective icon with all 5 slides:
Light the torch with our 4 Piece Puzzle Showing Sequential Flow Of Process With Respective Icon. Illuminate the road to name and fame.
FAQs for 4 piece puzzle showing sequential flow of process
Key components include clearly defined start/end points, sequential process steps, decision points with branching paths, input/output specifications, and responsible parties or roles. These elements work together by creating visual clarity, eliminating workflow ambiguities, and enabling stakeholder alignment, with many organizations finding that well-designed diagrams streamline operations and reduce process inefficiencies.
Visual storytelling enhances process flow understanding by transforming abstract steps into compelling narratives through icons, color coding, sequential imagery, and character-driven scenarios. This approach enables audiences to follow complex workflows more intuitively, with many organizations finding that storytelling elements increase retention rates and stakeholder engagement, ultimately delivering clearer communication and faster decision-making processes.
Common pitfalls include overcomplicating workflows, skipping decision points, unclear role definitions, missing exception handling, and inadequate stakeholder input during design. These issues often create confusion in organizations, with many teams finding that unclear symbols, missing feedback loops, and overly detailed steps can hinder rather than streamline operations, ultimately reducing efficiency and user adoption.
Process flow diagram detail levels depend on your audience, purpose, and complexity requirements, ranging from high-level overviews for executives to granular step-by-step workflows for operators. Organizations typically find that stakeholder needs, regulatory requirements, and implementation scope determine the appropriate depth, with many successful companies using tiered approaches that enable both strategic understanding and operational execution.
Color coding significantly enhances process flow clarity by categorizing steps, highlighting decision points, distinguishing different departments or roles, indicating priority levels, and showing status progression. Through strategic color schemes, organizations streamline communication across teams, reduce training time for complex workflows, and enable faster decision-making, with many companies finding that consistent color standards improve operational efficiency and reduce process-related errors.
Digital tools improve process flow diagram creation through automated formatting, real-time collaboration features, template libraries, drag-and-drop interfaces, and version control capabilities. These technologies streamline workflow design by enabling teams to simultaneously edit diagrams, automatically align elements, and integrate with existing business systems, ultimately delivering faster documentation processes and enhanced operational transparency across organizations.
Stakeholder feedback can be integrated through structured input sessions, collaborative workshops, user journey mapping, and iterative design reviews that capture diverse perspectives and requirements. Financial services and healthcare organizations increasingly use feedback loops during process mapping to identify bottlenecks, enhance user experiences, and ensure workflows meet operational needs, ultimately delivering more efficient processes and improved stakeholder satisfaction.
**INPUT**: What are the best practices for ensuring consistency in process flow layouts across multiple presentations? **OUTPUT**: Best practices include establishing standardized templates, maintaining consistent color schemes and typography, using uniform shapes and connector styles, and creating comprehensive style guides. These approaches streamline presentation development by ensuring visual coherence, reducing preparation time, and enhancing audience comprehension, with many organizations finding that standardized process flows ultimately deliver stronger stakeholder engagement and clearer communication outcomes. **Word count: 56 words**
Complex processes become more digestible through visual storytelling, progressive disclosure, simplified language, clear hierarchies, and interactive elements. By breaking down workflows into logical stages, using flowcharts and infographics, and providing real-world examples from sectors like manufacturing or healthcare, organizations enable stakeholders to grasp intricate operations quickly, ultimately improving training efficiency and decision-making across teams.
**INPUT**: What strategies can be used to highlight critical paths within a process flow? **OUTPUT**: Critical path highlighting strategies include color coding, bold formatting, increased line thickness, distinctive shapes, and sequential numbering to emphasize workflow dependencies. These visual techniques streamline project management by improving timeline clarity, resource allocation visibility, and bottleneck identification, with many organizations finding that enhanced path visualization ultimately delivers faster project completion and more efficient operational planning.
Icons and symbols communicate processes effectively by replacing complex text with universal visual cues, creating intuitive flow sequences, and establishing consistent visual hierarchies throughout your presentation. Strategic icon selection enhances comprehension across diverse audiences, with many organizations finding that well-designed process symbols reduce explanation time while improving stakeholder engagement and decision-making speed.
**INPUT**: What techniques can help in simplifying an overloaded process flow diagram? **OUTPUT**: Simplification techniques include grouping related steps into swim lanes, using color coding for different departments, eliminating redundant decision points, and creating hierarchical sub-processes. These approaches streamline visual complexity by reducing clutter, enhancing readability, and improving stakeholder comprehension, with many organizations finding that simplified diagrams accelerate training and process optimization.
Parallel processes in flowcharts should be represented using parallel paths that branch from a decision point and reconverge at a synchronization point, clearly showing simultaneous activities. This approach enables organizations to visualize concurrent operations like manufacturing assembly lines, loan processing workflows, or customer service interactions, ultimately streamlining resource allocation and reducing overall process completion times.
Effectiveness metrics include audience comprehension rates, decision-making speed, stakeholder engagement levels, implementation accuracy, and feedback quality scores. Through presentation analytics and post-session surveys, organizations can measure knowledge retention, process adoption rates, and time-to-understanding improvements, with many finding that well-designed flow presentations reduce training time and enhance operational efficiency.
Storytelling transforms process flows from abstract steps into memorable narratives by creating emotional connections, establishing context through relatable scenarios, and providing logical progression that mirrors natural thought patterns. Through narrative frameworks, organizations in healthcare, manufacturing, and financial services find that employees retain procedural knowledge significantly longer, ultimately reducing training time and improving operational compliance across complex workflows.
-
Unique design & color.
-
Amazing product with appealing content and design.