

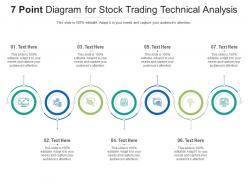
7 point diagram for stock trading technical analysis infographic template





Try Before you Buy Download Free Sample Product
 Impress Your
Audience
 100%
Editable
 Save Hours
of Time


Derive factual results using this 7 Point Diagram For Stock Trading Technical Analysis Infographic Template. Deploy this PowerPoint template to make and display prospective strategies using impressive graphics that enhance the visual quotient of the presentation. This infographic template also helps in elevating the aesthetic appeal of the presentation, making it useful for every organization. Apart from this, things and projects can be visualized from the onset using this PPT design. As this PowerPoint visual provides an abundance of information in a single layout, it can impress any viewer or higher managerial staff. It also boosts business actions by presenting flawless presentations. The biggest advantage of this slide is that it can be reproduced in various formats, including Google Slides. Therefore, download it now to present a unique presentation every time.
People who downloaded this PowerPoint presentation also viewed the following :
7 point diagram for stock trading technical analysis infographic template with all 2 slides:
Use our 7 Point Diagram For Stock Trading Technical Analysis Infographic Template to effectively help you save your valuable time. They are readymade to fit into any presentation structure.
-
Understandable and informative presentation.
-
Out of the box and creative design.
-
Commendable slides with attractive designs. Extremely pleased with the fact that they are easy to modify. Great work!