

Accounting dashboard income expenses and profit





Try Before you Buy Download Free Sample Product
 Impress Your
Audience
 100%
Editable
 Save Hours
of Time


Enlighten folks on baseless intolerance with our Accounting Dashboard Income Expenses And Profit. Condemn any acts of bigotry.
People who downloaded this PowerPoint presentation also viewed the following :
Accounting dashboard income expenses and profit with all 6 slides:
Equip folks to cater for the impact of external influences with our Accounting Dashboard Income Expenses And Profit. Identify the effects it can have.
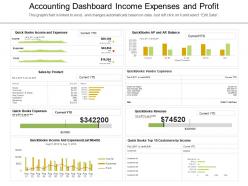


FAQs for Accounting dashboard income
Key metrics for small business accounting dashboards include cash flow, accounts receivable aging, accounts payable, profit margins, and expense tracking by category. These financial indicators streamline decision-making by providing real-time visibility into liquidity, operational efficiency, and profitability trends, with many small businesses finding that centralized dashboard monitoring enables faster responses to cash flow challenges and ultimately delivers better financial control.
Visualization tools enhance financial data understanding by transforming complex numbers into intuitive charts, graphs, heat maps, and trend lines that reveal patterns instantly. These visual elements enable finance teams to identify cash flow trends, budget variances, and performance metrics more quickly, while stakeholders across departments can grasp financial insights without deep accounting knowledge, ultimately accelerating decision-making processes.
Real-time data transforms accounting dashboards into dynamic decision-making tools by providing instant visibility into cash flow, expenses, revenue streams, and financial performance metrics as transactions occur. This immediacy enables finance teams to identify discrepancies quickly, make informed strategic decisions, and respond to financial trends proactively, ultimately delivering enhanced operational efficiency and competitive advantage in fast-paced business environments.
Accounting dashboards enhance budgeting and forecasting by providing real-time financial data visualization, automated variance analysis, predictive modeling capabilities, and seamless integration with existing accounting systems. Through interactive charts and trend analysis, finance teams can identify spending patterns, anticipate cash flow needs, and adjust projections quickly, ultimately delivering more accurate forecasts and strategic budget decisions.
Best practices for designing an intuitive accounting dashboard include clear data visualization, customizable layouts, real-time financial metrics, role-based access controls, and streamlined navigation pathways. These design principles enhance operational efficiency by minimizing cognitive load, accelerating decision-making processes, and enabling finance teams to identify trends quickly, ultimately delivering improved financial oversight and strategic business intelligence.
Accounting dashboards differ significantly across industries based on operational priorities and key metrics, with retail focusing on inventory turnover, sales per square foot, and seasonal trends, while manufacturing emphasizes production costs, material waste, and equipment efficiency. These industry-specific configurations enable finance teams to track relevant KPIs like customer acquisition costs in retail or manufacturing overhead ratios in production, ultimately delivering more targeted insights and strategic decision-making capabilities.
**INPUT**: What software tools are recommended for creating customizable accounting dashboards? **OUTPUT**: Recommended software tools include QuickBooks Advanced, Sage Intacct, NetSuite, Microsoft Power BI, and Tableau, each offering robust customization capabilities for financial reporting. These platforms enable organizations to streamline data visualization, automate reporting processes, and enhance decision-making accuracy, with many accounting firms finding that integrated dashboards ultimately deliver improved client services and operational efficiency. [Word count: 56 words]
Businesses ensure accounting dashboard accuracy through automated data validation, real-time synchronization with source systems, regular reconciliation processes, and implementing robust internal controls with audit trails. Through integrated ERP systems and automated workflows, organizations minimize manual data entry errors, establish clear approval hierarchies, and maintain comprehensive transaction tracking, ultimately delivering reliable financial insights and enhanced regulatory compliance.
Cash flow metrics on accounting dashboards reveal operational liquidity, seasonal patterns, payment cycles, and cash conversion efficiency across different business segments. These insights enable finance teams to optimize working capital management, predict cash shortfalls, negotiate better payment terms with vendors, and make strategic investment decisions, with many organizations finding improved financial forecasting accuracy and reduced liquidity risks.
An accounting dashboard supports financial health assessments by providing real-time visibility into key metrics like cash flow, profitability ratios, expense trends, and budget variances through automated data visualization. These centralized insights enable finance teams to identify potential issues early, track performance against benchmarks, and make data-driven strategic decisions, with many organizations finding faster, more accurate financial evaluations.
Integrating multiple data sources into accounting dashboards presents challenges including data format inconsistencies, real-time synchronization issues, security protocols, and system compatibility conflicts. These technical hurdles require strategic planning and robust integration platforms, with many financial institutions finding that proper data mapping and automated reconciliation processes ultimately streamline operations while ensuring accuracy and regulatory compliance.
Businesses can measure accounting dashboard ROI by tracking reduced manual processing time, decreased error rates, faster financial reporting cycles, and improved compliance accuracy. These dashboards streamline operations by automating data consolidation, enhancing decision-making speed, and minimizing audit costs, with many organizations finding 30-40% time savings in financial processes, ultimately delivering significant operational efficiency and competitive advantage.
Non-profit accounting dashboards should prioritize program expense ratio, fundraising efficiency, donor retention rates, cash flow projections, and grant compliance metrics. These KPIs enable organizations to demonstrate fiscal responsibility while optimizing resource allocation, with many non-profits finding that tracking these metrics enhances donor confidence, streamlines reporting to stakeholders, and ultimately delivers greater mission impact through improved financial transparency.
User access and security significantly impact accounting dashboard effectiveness by controlling data visibility, ensuring regulatory compliance, and maintaining financial data integrity. Proper role-based permissions enable finance teams to access relevant information while preventing unauthorized modifications, with many organizations finding that secure, tiered access systems streamline audit processes, enhance accountability, and ultimately deliver greater operational confidence and stakeholder trust.
Accounting dashboards enhance compliance and audit readiness by providing real-time monitoring of regulatory requirements, automated compliance tracking, centralized documentation, and standardized reporting processes. These systems streamline audit preparation by maintaining detailed transaction histories, flagging potential compliance issues early, and generating comprehensive audit trails, with many financial institutions finding that dashboard-driven compliance reduces audit preparation time while ensuring regulatory adherence.
No Reviews