

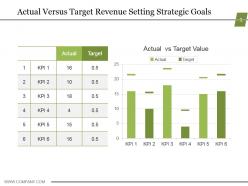
Actual versus target revenue setting strategic goals example of ppt





Try Before you Buy Download Free Sample Product
 Impress Your
Audience
 100%
Editable
 Save Hours
of Time


Get into gear with our Actual Versus Target Revenue Setting Strategic Goals Example Of Ppt. Your thoughts will definitely drive the audience.
People who downloaded this PowerPoint presentation also viewed the following :
Actual versus target revenue setting strategic goals example of ppt with all 5 slides:
A good media for most businesses are our Actual Versus Target Revenue Setting Strategic Goals Example Of Ppt. They are malleable and very interactive.


FAQs for Actual versus target revenue setting strategic goals
Key performance indicators for revenue performance analysis include revenue growth rate, customer acquisition cost, average revenue per user, customer lifetime value, and conversion rates across sales funnels. These metrics enable organizations to identify revenue drivers, optimize pricing strategies, and enhance customer retention efforts, with many businesses finding that combining leading and lagging indicators delivers comprehensive insights for strategic decision-making.
Historical revenue data enables forecasting through trend analysis, seasonal pattern identification, growth rate calculations, and predictive modeling techniques. By examining past performance across different periods, markets, and product lines, organizations can identify cyclical patterns, market responses, and growth trajectories, ultimately delivering more accurate budget planning and strategic resource allocation for sustained competitive advantage.
Common pitfalls include focusing solely on top-line growth without examining underlying drivers, ignoring seasonal variations, comparing metrics across different time periods inconsistently, and overlooking customer segmentation impacts. These analytical oversights can mislead strategic decisions, with many organizations finding that comprehensive revenue analysis, incorporating customer lifetime value, market trends, and operational efficiency metrics, ultimately delivers more accurate performance insights and competitive advantage.
Seasonality creates predictable revenue fluctuations across quarters, with businesses experiencing peaks during holidays, summer periods, or industry-specific cycles, while facing slower periods that can strain cash flow. Smart organizations adjust by diversifying product lines, implementing dynamic pricing strategies, and building seasonal forecasting models, with many retailers and hospitality companies finding that proactive inventory management and targeted marketing campaigns ultimately smooth revenue curves and maintain competitive advantage year-round.
Customer segmentation enhances revenue performance analysis by identifying high-value customer groups, revealing spending patterns across demographics, uncovering seasonal trends, and highlighting underperforming segments requiring strategic attention. Through targeted segmentation, organizations can optimize pricing strategies, personalize marketing campaigns, and allocate resources more effectively, with many businesses finding that segmented analysis delivers significantly higher conversion rates and customer lifetime value.
External economic factors impact revenue performance through interest rate fluctuations, consumer spending patterns, supply chain disruptions, and regulatory changes that affect operational costs and market demand. While sectors like healthcare and utilities often demonstrate resilience during downturns, industries such as retail, hospitality, and manufacturing experience more significant volatility, with many organizations finding that diversified revenue streams and adaptive pricing strategies help maintain competitive advantage across varying economic cycles.
Pricing strategy directly influences revenue performance by determining profit margins, market positioning, customer acquisition rates, and competitive differentiation within target segments. Through strategic pricing models, organizations optimize revenue streams, enhance customer lifetime value, and maximize market share penetration, with many retail and SaaS companies finding that dynamic pricing approaches ultimately deliver sustained growth and improved profitability.
Revenue performance analysis integrates with marketing efforts by identifying high-performing customer segments, optimizing campaign ROI, tracking conversion rates across channels, and aligning marketing spend with revenue-generating activities. Through data-driven insights, marketing teams can refine targeting strategies, adjust messaging for better engagement, and allocate budgets more effectively, ultimately delivering higher conversion rates and sustainable revenue growth.
Effective revenue performance analysis tools include Salesforce Analytics, HubSpot Revenue Operations, Tableau, Power BI, and specialized platforms like ChartMogul or ProfitWell. These solutions streamline data integration, automate reporting processes, and deliver comprehensive dashboards, with many organizations finding that combining CRM analytics with business intelligence tools ultimately enhances forecasting accuracy and strategic decision-making.
Qualitative factors like customer satisfaction can be integrated through customer lifetime value calculations, Net Promoter Score correlations with revenue trends, churn rate analysis, and satisfaction-to-retention modeling. These metrics enable organizations to connect customer experience data directly to revenue outcomes, with many companies finding that higher satisfaction scores correlate with increased repeat purchases and reduced acquisition costs.
Key revenue performance benchmarks include revenue growth rate, revenue per customer, customer acquisition cost, lifetime value ratios, and profit margins by segment. These metrics enable businesses to assess competitive positioning across industries like SaaS, retail, and manufacturing, with many organizations finding that combining multiple benchmarks delivers more comprehensive insights than single-metric comparisons, ultimately enhancing strategic decision-making.
Revenue performance analysis informs product development by identifying high-performing segments, customer preferences, and market gaps through sales data, profitability metrics, and growth trends. This strategic combination enables organizations to prioritize resource allocation toward promising innovations, streamline underperforming offerings, and accelerate time-to-market for solutions that deliver competitive advantage and sustainable growth.
Analyzing revenue performance across sales channels reveals conversion rates, customer acquisition costs, seasonal patterns, channel profitability, and customer lifetime value variations. These insights enable organizations to optimize resource allocation, identify high-performing channels, and streamline underperforming ones, with many retailers finding that strategic channel combination ultimately delivers enhanced customer experiences and competitive advantage.
Revenue performance directly influences market position through competitive advantages, pricing power, and investment capacity for innovation and expansion. Companies with strong revenue growth typically strengthen their market leadership by reinvesting in product development, marketing initiatives, and strategic acquisitions, while weaker revenue performance can erode market share, ultimately creating a cycle where financial success and market dominance reinforce each other.
Organizations can ensure continuous improvement in revenue performance by implementing regular performance reviews, establishing key performance indicators, conducting competitor analysis, investing in employee training, and leveraging data analytics tools. These strategic approaches enable businesses to identify revenue gaps, optimize pricing strategies, and enhance customer retention, with many companies finding that systematic performance monitoring ultimately delivers sustained growth and competitive advantage in increasingly dynamic markets.
-
Unique research projects to present in meeting.
-
Easy to edit slides with easy to understand instructions.