

Africa map ppt show format ideas





Try Before you Buy Download Free Sample Product
 Impress Your
Audience
 100%
Editable
 Save Hours
of Time


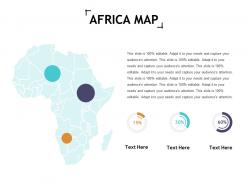
Define areas of control with our Africa Map Ppt Show Format Ideas. They enable geo-fencing.
People who downloaded this PowerPoint presentation also viewed the following :
Africa map ppt show format ideas with all 5 slides:
Artfully combine your abilities with our Africa Map Ppt Show Format Ideas. You will find it extremely fulfilling.


FAQs for Africa map ppt
Effective Africa map presentations include demographic data overlays, economic indicators, regional trade routes, natural resource distributions, and infrastructure development markers. These elements enhance audience understanding by providing geographical context, highlighting economic opportunities, and illustrating strategic connections across sectors, with many organizations finding that comprehensive visual data storytelling delivers stronger stakeholder engagement and more informed decision-making processes.
**INPUT**: How can I visually emphasize population density in different African regions using maps? **OUTPUT**: Visual emphasis techniques include heat maps with color gradients, proportional symbols, dot density mapping, choropleth shading, and 3D population towers overlaid on geographic boundaries. These visualization methods streamline demographic storytelling by highlighting urban concentrations like Lagos and Cairo, contrasting sparse Saharan regions with dense coastal areas, ultimately delivering clearer insights for strategic planning and resource allocation across diverse African markets. **Word count: 58 words**
Methods include cultural region mapping, ethnolinguistic overlays, traditional art integration, festival calendars, and heritage site highlighting. These approaches enhance understanding by showcasing language families, traditional crafts, music styles, and ceremonial practices across different regions, with many educational institutions and cultural organizations finding that visual storytelling through interactive elements delivers deeper audience engagement and cultural appreciation.
Incorporate statistical data through color-coded regions, selective key metrics displayed as callouts, interactive overlays that reveal details on demand, and progressive disclosure techniques that build information gradually. These approaches enable audiences to digest complex African economic, demographic, or development data systematically, with many presenters finding that combining visual hierarchies with storytelling creates more engaging, memorable presentations that drive strategic insights.
**INPUT**: What tools or software are best for interactive maps for a presentation on Africa? **OUTPUT**: Interactive mapping tools include ArcGIS Online, Tableau, Google Earth Pro, Mapbox, and specialized presentation platforms like Prezi or PowerBI. These technologies streamline geographic storytelling by enabling real-time data visualization, customizable overlays, and audience engagement features, with many organizations finding that interactive elements enhance retention and deliver more compelling stakeholder presentations.
Organize content by resource categories including minerals, oil and gas reserves, agricultural products, water resources, and renewable energy potential, using color-coded legends and regional clustering. Through interactive overlays, presentations can highlight extraction locations, trade routes, and economic impact data, enabling stakeholders to visualize resource distribution patterns and identify strategic investment opportunities across the continent.
**INPUT**: What colors or themes are recommended for crafting a visually appealing Africa map presentation? **OUTPUT**: Recommended colors include earth tones like terracotta, ochre, and deep greens, vibrant oranges and golds reflecting sunsets, or professional blues and grays for corporate presentations. These palettes enhance readability while respecting cultural authenticity, with many organizations finding that warm, natural themes resonate across diverse audiences, ultimately delivering stronger engagement and more memorable business communications.
You can highlight major landmarks by incorporating interactive maps with clickable hotspots, visual timelines connecting sites to historical periods, and region-specific slides featuring iconic locations like the Pyramids of Giza, Victoria Falls, and Great Rift Valley. These approaches enhance audience engagement through storytelling elements, comparative size references, and cultural context explanations, ultimately delivering memorable presentations that showcase Africa's rich heritage and geographical diversity.
Common misconceptions include viewing Africa as a single country rather than 54 diverse nations, assuming widespread poverty without acknowledging economic growth, and overlooking technological advancement and innovation hubs. Your presentation should showcase Africa's economic diversity, rapid digitization in countries like Kenya and Nigeria, and emerging markets across sectors like banking, telecommunications, and manufacturing, ultimately delivering a more accurate, nuanced perspective that highlights strategic opportunities.
Animated maps enhance storytelling by revealing data progressively, highlighting regional connections, and illustrating changes over time through dynamic transitions and visual effects. These presentations enable audiences to follow complex narratives about economic development, population growth, or resource distribution across African nations, ultimately delivering more engaging experiences and improved comprehension compared to static alternatives.
Techniques include choropleth mapping with GDP color gradients, animated timeline slides showing growth trajectories, comparative bar charts highlighting sector performance, before-and-after infrastructure imagery, and investment flow diagrams. These visualization methods streamline complex economic data by combining geographic context with quantitative analysis, enabling stakeholders to identify emerging markets and strategic opportunities across the continent.
Incorporating infographics alongside African maps enhances understanding through data visualization elements like population charts, economic indicators, resource distribution graphs, and demographic breakdowns positioned strategically around regional boundaries. This combination enables viewers to grasp complex socioeconomic patterns, trade relationships, and development metrics across different African regions, ultimately delivering more comprehensive insights and facilitating better strategic decision-making for organizations operating across the continent.
Consider your audience's geographic knowledge level, cultural sensitivity requirements, and specific regional interests or business focus areas. Design presentations should accommodate varying familiarity with African countries, avoid stereotypical imagery, use appropriate color schemes that respect cultural contexts, and emphasize relevant data points, with many presenters finding that tailored regional detail and respectful visual representation significantly enhance audience engagement and comprehension.
Cross-border issues can be represented through layered maps showing migration corridors, trade flow arrows, and regional connectivity patterns, combined with timeline animations and comparative data visualizations. These approaches enable audiences to grasp complex interconnections across national boundaries, with presentations on East African wildlife corridors or West African trade networks demonstrating how visual storytelling enhances understanding of transnational challenges and opportunities.
Satellite images enhance Africa map presentations by providing real-time geographical data, accurate territorial boundaries, environmental changes, and infrastructure development details. These high-resolution visuals enable organizations to showcase economic opportunities, track climate patterns, and demonstrate regional connectivity across sectors like agriculture, mining, and telecommunications, ultimately delivering more compelling and data-driven presentations.
No Reviews