

After market investment pitch deck powerpoint presentation slides





Try Before you Buy Download Free Sample Product
 Impress Your
Audience
 100%
Editable
 Save Hours
of Time


Introducing our after market investment pitch deck PowerPoint presentation slides. Persuade investors to provide funding for the growth of your company with the help of our promotion assistance PowerPoint deck. This pitch elevation PPT theme gives the operational and financial overview of the company. This ready-made company pitch deck PowerPoint design contains a slide that will help you in detailing the unique selling points of your company. Utilizing this corporate publicity PPT layout will help you talk about the key historical events of your company. Incorporating this company investment PPT theme lets you determine a profitable business model for your company. This pitch finance promotion PowerPoint creative set contains a slide that relays the competitive advantage to the business. This investment fund transfer PowerPoint creative set contains a slide that has all the important icons related to the investment pitch deck. Download this PPT slide to explore true perfection.
People who downloaded this PowerPoint presentation also viewed the following :
Content of this Powerpoint Presentation
Slide 1: This slide introduces After Market Investment (Pitch Deck). State Your Company Name and begin.
Slide 2: This is an Agenda slide. State your agendas here.
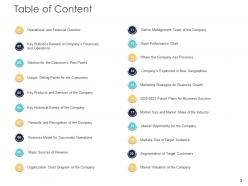
Slide 3: This slide shows Table of Content for the presentation.
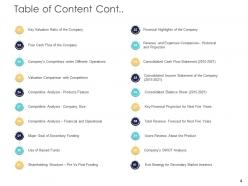
Slide 4: This slide presents Table of Content for the presentation.
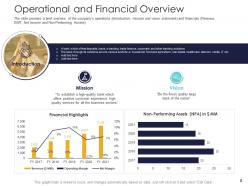
Slide 5: This slide shows Operational and Financial Overview.
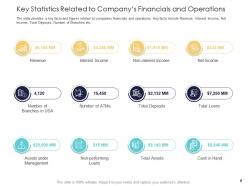
Slide 6: This slide displays Key Statistics Related to Company’s Financials and Operations.
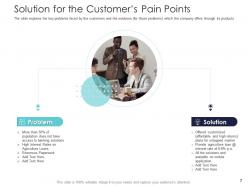
Slide 7: The slide represents the key problems faced by the customers and the solutions (for those problems) which the company offers through its products.
Slide 8: This slide shows Unique Selling Points for the Customers.
Slide 9: The slide presents a key products and services of the company.
Slide 10: The slide covers all the major historic events of the company including founding, major acquisition, new product launch, partnership, expansion etc.
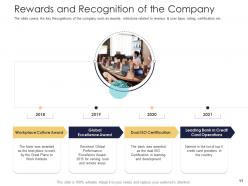
Slide 11: The slide displays the key Recognitions of the company such as awards, milestone related to revenue & user base, rating, certification etc.
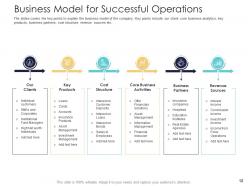
Slide 12: This slide represents Business Model for Successful Operations.
Slide 13: The slide provides the details about major sources of revenue i.e. interest on loan, investment income, fee income etc.
Slide 14: This slide presents Organization Chart Diagram of the Company.
Slide 15: The slide provides the diagram which shows ownership structure (holding and subsidiary companies) of the company.
Slide 16: The slide displays the name, designation and brief biography of key senior level executives.
Slide 17: The slide represents the line chart of stock price of the company in last five years.
Slide 18: The slide provides the geographic map and the name of countries.
Slide 19: This slide presents Where the Company has Presence.
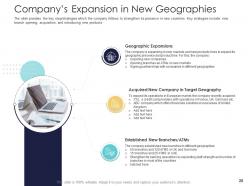
Slide 20: The slide provides the key step/strategies which the company follows to strengthen its presence in new countries.
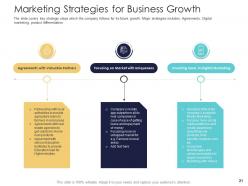
Slide 21: The slide displays key strategic steps which the company follows for its future growth.
Slide 22: The slide represents the company’s expansion plans: market penetration, merger/acquisition, diversification, market expansion, and strengthen financials etc.
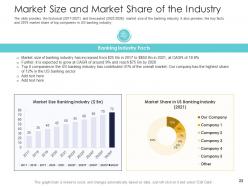
Slide 23: This slide shows Market Size and Market Share of the Industry.
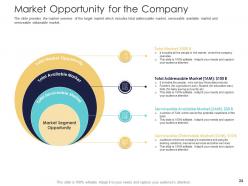
Slide 24: This slide presents Market Opportunity for the Company.
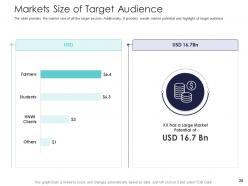
Slide 25: The slide provides the market size of all the target sectors.
Slide 26: The slide displays the segmentation about the target customers of the company.
Slide 27: This slide represents Market Valuation of the Company.
Slide 28: The slide provides the key ratios and a brief summary about the relevance of those ratios.
Slide 29: The slide presents forecasted free cash flow of the company for next five years.
Slide 30: The slide provides the key competitors of the company in different operations i.e. banking, insurance, asset management and other businesses
Slide 31: The slide displays relative valuation of the company comparing to its competitors.
Slide 32: The slide represents the Competitive landscape of the company on the basis of products.
Slide 33: The slide provides the Competitive landscape of the company on the basis of company’s size.
Slide 34: This slide presents Competitive Analysis – Financial and Operational Data.
Slide 35: The slide provides major goals of funding i.e. market share growth, increase in production capacity and revenue, hire new employees, reduce operating cost etc.
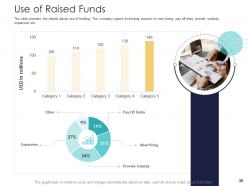
Slide 36: The slide displays the details about use of funding.
Slide 37: This slide represents Shareholding Structure – Pre Vs Post Funding.
Slide 38: The slide provides the financials highlight of the company including: revenue and net interest income.
Slide 39: This slide presents Revenue and Expenses Comparison– Historical and Projection.
Slide 40: This slide shows Consolidated Income Statement of the Company.
Slide 41: The slide displays the historical data of the company’s cash flow statement.
Slide 42: This is another slide continuing the historical data of the company’s cash flow statement from the year 2017-2021.
Slide 43: The slide provides the historical data of the company’s balance sheet.
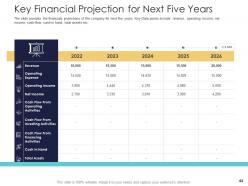
Slide 44: This is another slide continuing Key Financial Projection for Next Five Years.
Slide 45: The slide provides the revenue projections of the company for next five years.
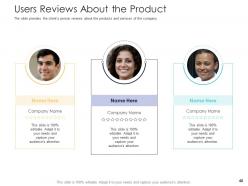
Slide 46: The slide displays the client’s person reviews about the products and services of the company.
Slide 47: The slide represents the SWOT (strengths, weakness, opportunity and threat) points to analyse the business performance of the company
Slide 48: The slide provides most profitable/feasible ways for investors to exit from their investment in the company.
Slide 49: This slide presents After Market Investment (Pitch Deck)-Icons.
Slide 50: This slide is titled as Additional Slides for moving forward.
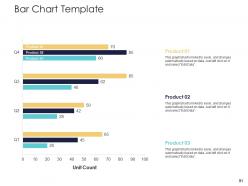
Slide 51: This slide displays Bar Chart Template with three products comparison.
Slide 52: This slide represents Clustered Column-Line with three products comparison.
Slide 53: This is Our Mission slide with related imagery and text.
Slide 54: This is a Timeline slide. Show data related to time intervals here.
Slide 55: This is About Us slide to show company specifications etc.
Slide 56: This slide displays Post It Notes. Post your important notes here.
Slide 57: This slide represents Venn diagram with text boxes.
Slide 58: This slide shows Puzzle with related icons and text.
Slide 59: This is a Financial slide. Show your finance related stuff here.
Slide 60: This is a Thank You slide with address, contact numbers and email address.
After market investment pitch deck powerpoint presentation slides with all 60 slides:
Use our After Market Investment Pitch Deck Powerpoint Presentation Slides to effectively help you save your valuable time. They are readymade to fit into any presentation structure.



















FAQs for After market investment pitch deck
Key components include market opportunity analysis, competitive landscape assessment, financial projections, management team credentials, and growth strategy roadmap. These elements work together by demonstrating market size and potential, showcasing differentiation from competitors, and presenting realistic revenue forecasts, with many investors finding that aftermarket businesses offering replacement parts, services, and upgrades deliver predictable recurring revenue streams and strong profit margins.
Visual elements enhance aftermarket investment pitch storytelling by creating compelling narratives through market trend charts, customer journey maps, competitive positioning matrices, and revenue growth projections. These graphics transform complex aftermarket data into digestible insights, with many investors finding that visual storytelling accelerates decision-making while demonstrating market opportunities and competitive advantages more effectively.
Market validation data should include total addressable market size, growth rates, customer segmentation demographics, competitive landscape analysis, and regulatory environment assessments. Through comprehensive market research, aftermarket businesses can demonstrate demand patterns, pricing elasticity, and distribution channel effectiveness across automotive, industrial, and technology sectors, ultimately delivering investor confidence and strategic positioning advantages.
Effectively communicating an aftermarket investment opportunity's value proposition requires highlighting market size, growth potential, recurring revenue streams, and competitive advantages through clear financial projections and customer data. Successful presentations emphasize scalability across industries like automotive, aerospace, or technology, demonstrating how aftermarket services deliver higher margins, predictable cash flows, and customer loyalty, ultimately positioning the opportunity as a strategic investment with sustainable returns.
Common aftermarket investment misconceptions include viewing them as purely defensive plays, assuming limited growth potential, underestimating technological innovation opportunities, and believing they're recession-proof without strategic positioning. Successful aftermarket businesses demonstrate that through digital transformation, subscription models, and data analytics, companies achieve higher margins, recurring revenue streams, and competitive moats, with many investors finding that well-positioned aftermarket strategies deliver sustained growth and market expansion.
Competitive analysis is crucial in aftermarket investment pitch decks, providing investors with market positioning clarity, differentiation strategies, and growth opportunity validation. It should entail direct competitor profiling, market share analysis, pricing comparisons, service gap identification, and competitive advantage mapping, with many investors finding that comprehensive competitive insights demonstrate strategic market understanding and scalability potential.
Customer feedback and testimonials serve as powerful validation tools in aftermarket investment presentations, demonstrating proven market demand, customer satisfaction levels, and revenue sustainability across diverse sectors. These authentic voices help investors understand real-world application success, with many aftermarket companies finding that detailed customer testimonials significantly strengthen their credibility while showcasing measurable outcomes like cost savings and operational efficiency improvements.
Financial projections in aftermarket investment pitch decks require detailed market sizing analysis, historical performance data, growth trajectory modeling, and sensitivity scenarios that account for economic cycles. These projections should incorporate parts availability trends, customer retention rates, and service revenue streams, with many aftermarket businesses finding that conservative estimates with clear assumptions build investor confidence while demonstrating sustainable profitability and scalable market opportunities.
Tailoring aftermarket investment pitch decks involves emphasizing growth metrics and market expansion for venture capitalists, while highlighting founder expertise and early traction for angel investors. VCs typically focus on scalability, competitive positioning, and exit strategies, whereas angels prioritize passionate storytelling, product-market fit demonstrations, and personal connections, with many successful companies finding that customizing financial projections and risk assessments for each investor type significantly enhances funding success rates.
Aftermarket industry trends can be effectively showcased through data visualizations highlighting market growth, consumer behavior shifts, digitalization adoption rates, and emerging technologies like IoT and predictive analytics. Strategic presentation of these trends through comparative charts, market size projections, and sector-specific examples enables investors to understand growth opportunities, while demonstrating how your business capitalizes on evolving customer demands and technological advancements for competitive advantage.
Critical risk assessment elements include market saturation analysis, supply chain disruption potential, regulatory compliance requirements, competitive pricing pressures, and technology obsolescence risks. These components enable investors to evaluate operational resilience, market positioning strategies, and long-term viability, with many aftermarket businesses finding that transparent risk disclosure ultimately strengthens investor confidence and strategic partnerships.
Creating a compelling call to action for aftermarket investors requires emphasizing scalable market opportunities, proven revenue models, and clear competitive advantages through strategic positioning. Successful aftermarket pitches highlight specific growth metrics, demonstrate defensible market share in fragmented industries, and showcase how established customer relationships deliver predictable cash flows, ultimately positioning the investment as both stable and growth-oriented in an increasingly consolidating marketplace.
Case studies can be incorporated through dedicated slides showcasing quantitative results, before-and-after scenarios, customer testimonials, and visual proof points like charts or images. These elements work most effectively when positioned after problem identification but before financial projections, with successful aftermarket companies finding that specific metrics, timelines, and credible customer logos significantly enhance investor confidence and demonstrate proven market validation.
Effective aftermarket investment pitch decks typically feature 10-15 slides with clean, professional visual design, strategic use of charts and graphs, and minimal text per slide to maintain focus. The format should emphasize visual storytelling through market data, growth projections, and competitive positioning, with many investors finding that concise presentations delivered in 15-20 minutes ultimately enhance engagement and facilitate meaningful discussion.
Use clear, jargon-free language that focuses on universal business metrics like revenue growth, market share, and ROI rather than technical aftermarket terminology. Structure your narrative around familiar concepts, incorporate visual aids to support complex data, and provide context for industry-specific terms, with many successful aftermarket pitches finding that emphasizing customer pain points and scalable solutions resonates across diverse investor backgrounds, ultimately delivering broader appeal and enhanced funding opportunities.
-
Great designs, Easily Editable.
-
Topic best represented with attractive design.
-
Really like the color and design of the presentation.
-
Great designs, really helpful.
-
The Designed Graphic are very professional and classic.
-
Helpful product design for delivering presentation.
-
Topic best represented with attractive design.
-
Good research work and creative work done on every template.