


AIOps Playbook KPI Dashboard For Tracking Business Performance Ppt Structure




Try Before you Buy Download Free Sample Product
 Impress Your
 Audience
 100%
100% Editable
 Save Hours
 of Time


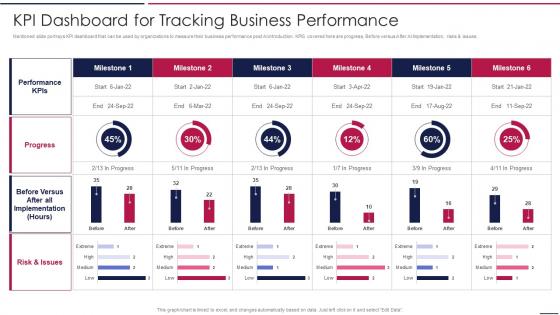
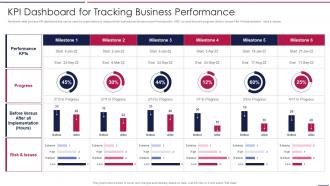
Mentioned slide portrays KPI dashboard that can be used by organizations to measure their business performance post AI introduction. KPIS covered here are progress, Before versus After AI Implementation, risks and issues.
People who downloaded this PowerPoint presentation also viewed the following :
AIOps Playbook KPI Dashboard For Tracking Business Performance Ppt Structure with all 7 slides:
Use our AIOps Playbook KPI Dashboard For Tracking Business Performance Ppt Structure to effectively help you save your valuable time. They are readymade to fit into any presentation structure.





FAQs for AIOps Playbook KPI Dashboard For Tracking Business
Essential AIOps KPI dashboard metrics include mean time to detection (MTTD), mean time to resolution (MTTR), incident volume trends, system availability percentages, and anomaly detection accuracy rates. These metrics streamline operational efficiency by enabling proactive monitoring, reducing downtime costs, and accelerating incident response, with many IT organizations finding that comprehensive dashboards deliver 40-60% faster resolution times and significantly improved service reliability.
Predictive analytics enhances AIOps KPI dashboards by forecasting system failures, resource bottlenecks, and performance degradation before they occur, enabling proactive maintenance and capacity planning. Through machine learning algorithms, organizations can anticipate infrastructure needs, prevent costly downtime, and optimize resource allocation, ultimately delivering improved system reliability and reduced operational costs across their IT environments.
User experience plays a crucial role by ensuring dashboards present complex AIOps data through intuitive interfaces, customizable visualizations, and role-based access controls that match different stakeholder needs. Effective UX design enables IT teams, executives, and operations managers to quickly interpret performance metrics, incident patterns, and predictive insights, ultimately delivering faster decision-making and improved operational efficiency across organizations.
AIOps KPI update frequency depends on data criticality, system volatility, and stakeholder requirements, with real-time updates for critical alerts, hourly updates for operational metrics, and daily or weekly updates for strategic performance indicators. Organizations typically balance system resources with business needs, with many finding that high-frequency financial services require minute-level updates while manufacturing environments often benefit from hourly operational dashboards, ultimately delivering timely insights without overwhelming users.
Best practices for visualizing complex data in AIOps KPI dashboards include using layered hierarchical displays, real-time heat maps, trend-based line charts, contextual alerting systems, and interactive drill-down capabilities. These approaches streamline operational monitoring by presenting critical metrics at-a-glance, enabling rapid anomaly detection, and facilitating deeper analysis when needed, with many IT organizations finding that well-designed dashboards significantly reduce incident response times and enhance overall system reliability.
Integration with existing IT service management tools enhances AIOps KPI dashboard effectiveness by consolidating data sources, automating incident workflows, and providing comprehensive visibility across the entire IT ecosystem. Through seamless ITSM connectivity, organizations streamline alert management, accelerate root cause analysis, and enable proactive service optimization, with many enterprises finding that unified dashboards reduce resolution times while improving operational transparency.
Common pitfalls include overwhelming users with excessive metrics, neglecting stakeholder alignment on key objectives, poor data quality integration, insufficient real-time capabilities, and lack of actionable insights. Many organizations find that focusing on vanity metrics rather than business-critical KPIs, inadequate visualization design, and missing alert prioritization ultimately undermines operational efficiency and decision-making effectiveness.
Machine learning algorithms automate KPI tracking in AIOps by analyzing historical performance data, identifying patterns in system behavior, and predicting potential issues before they impact operations. These algorithms streamline monitoring processes by automatically correlating metrics across infrastructure components, reducing manual oversight requirements, and enabling real-time anomaly detection, ultimately delivering faster incident response and enhanced operational efficiency.
**INPUT**: What comparisons should be made when benchmarking KPIs on an AIOps dashboard against industry standards? **OUTPUT**: Benchmarking AIOps KPIs should compare mean time to detection, resolution rates, alert accuracy, system uptime, and incident volumes against sector-specific standards. Organizations in banking, healthcare, and retail find that measuring their performance against industry peers reveals optimization opportunities, while tracking operational efficiency gains and cost reduction metrics ultimately delivers competitive advantage in increasingly complex IT environments.
Different stakeholders require tailored AIOps KPI dashboard views because IT teams focus on technical metrics like incident response times, system performance, and infrastructure health, while business leaders prioritize operational efficiency, cost reduction, and service availability impacts. These customized dashboards enable IT professionals to optimize system performance and automate troubleshooting, while executives track strategic outcomes like reduced downtime costs and improved customer satisfaction, ultimately delivering comprehensive visibility across technical and business objectives.
Security considerations for sharing AIOps KPI dashboards include role-based access controls, data encryption, audit trails, secure authentication protocols, and network segmentation. These safeguards streamline compliance requirements while protecting sensitive operational data, with many organizations finding that implementing layered security frameworks ultimately delivers enhanced stakeholder confidence and regulatory adherence across distributed teams.
Historical data analysis informs AIOps KPI dashboard metrics by identifying recurring patterns, baseline performance levels, seasonal trends, and anomaly thresholds that enable predictive insights. Through machine learning algorithms, organizations can establish meaningful benchmarks for system performance, automate alert prioritization, and optimize resource allocation, with many IT teams finding that data-driven metrics significantly enhance operational efficiency and reduce incident response times.
Real-time data processing significantly enhances AIOps KPI dashboard decision-making by enabling instant anomaly detection, immediate performance alerts, and continuous system monitoring across network infrastructure. This capability allows IT teams to identify bottlenecks, predict failures, and optimize resource allocation within minutes rather than hours, ultimately delivering faster incident resolution and improved operational efficiency.
User feedback can be effectively incorporated through continuous user interviews, usability testing sessions, feedback collection widgets within the dashboard, and regular stakeholder workshops to identify pain points and improvement opportunities. By implementing agile design sprints that directly address user concerns, organizations can enhance dashboard functionality, streamline data visualization, and ultimately deliver more intuitive monitoring experiences that accelerate incident response times.
Emerging AIOps advancements include predictive analytics with machine learning algorithms, natural language processing for conversational interfaces, automated root cause analysis, real-time anomaly detection, and intelligent alert prioritization. These technologies streamline dashboard functionality by delivering proactive insights, reducing manual monitoring overhead, and enabling faster incident resolution, with many organizations finding that enhanced predictive capabilities ultimately transform reactive IT operations into strategic, data-driven decision-making processes.
-
Fantastic collection of visually appealing PowerPoint templates. They certainly uplift the look of the presentation.
-
“I required a slide for a board meeting and was so satisfied with the final result !! So much went into designing the slide and the communication was amazing! Can’t wait to have my next slide!”