


Amazon seasonality trends in sales revenue q1 2017 q4 2018





Try Before you Buy Download Free Sample Product
 Impress Your
Audience
 100%
Editable
 Save Hours
of Time


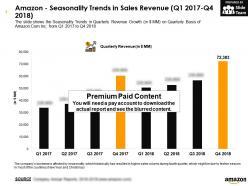
The slide shows the Seasonality Trends in Quarterly Revenue Growth in JPY MM on Quarterly Basis of Amazon.Com Inc from Q1 2017 to Q4 2018.
This is a professionally designed visual chart for Amazon Seasonality Trends In Sales Revenue Q1 2017 Q4 2018. This is part of our Data and Statistics products selection, and you will need a Paid account to download the actual report with accurate data and sources. Downloaded report will contain the editable graph with accurate data, an excel table with the actual data, the exact source of the data and the release date. The slide shows the Seasonality Trends in Quarterly Revenue Growth in JPY MM on Quarterly Basis of Amazon.Com Inc from Q1 2017 to Q4 2018. Download it immediately and use it for your business.
People who downloaded this PowerPoint presentation also viewed the following :
Amazon seasonality trends in sales revenue q1 2017 q4 2018 with all 3 slides:
Enable folks to get an inkling with our Amazon Seasonality Trends In Sales Revenue Q1 2017 Q4 2018. Enlighten them on anticipating events.


Most Relevant Reviews
No Reviews