

Asia Maps Powerpoint Ppt Template Bundles PU Maps




Try Before you Buy Download Free Sample Product
 Impress Your
 Audience
 100%
100% Editable
 Save Hours
 of Time


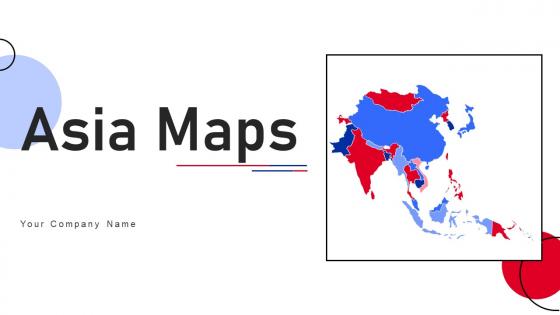
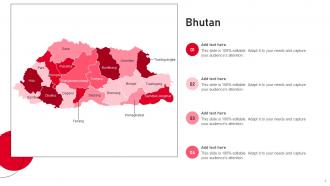
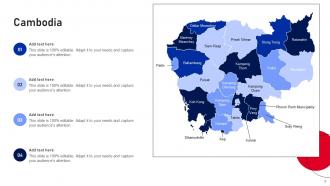
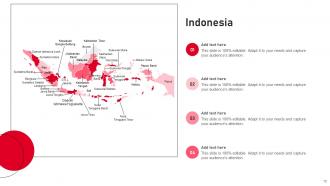
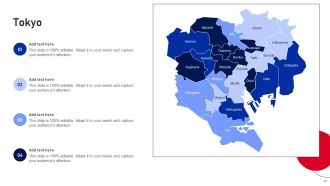
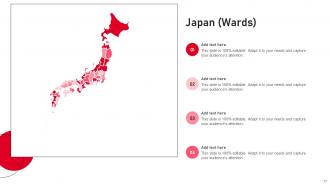
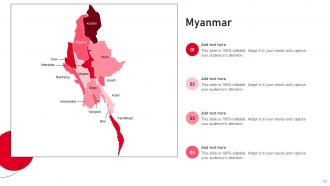
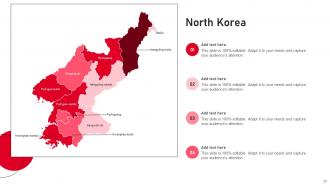
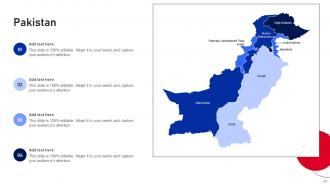
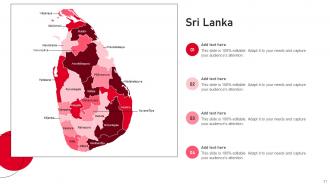
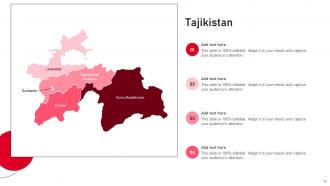
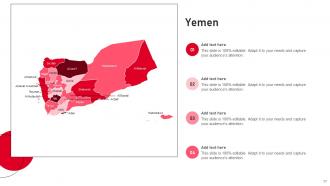
Embark on a detailed exploration of Asia with our Asia Maps PowerPoint presentation. Uncover the distinctive features of Bhutan with an Outlined Map, providing insights into its geographical nuances. Delve into the topography of Cambodia through a Physical Map, capturing the diverse landscapes of this Southeast Asian gem. Navigate through the unique geography of Kyrgyzstan with a dedicated map, gaining a nuanced understanding of this Central Asian nation. Customize your insights with a Blank Map of Thailand, ideal for presentations requiring personalized details. Explore the beauty of Zambia through a comprehensive map. Elevate your presentations with these meticulously crafted maps, offering a rich visual experience and facilitating a deeper understanding of Asias diverse regions.
People who downloaded this PowerPoint presentation also viewed the following :
Asia Maps Powerpoint Ppt Template Bundles PU Maps with all 47 slides:
Use our Asia Maps Powerpoint Ppt Template Bundles PU Maps to effectively help you save your valuable time. They are readymade to fit into any presentation structure.
























FAQs for Asia Maps Powerpoint Ppt Template
Key elements include geographical boundary changes, colonial influence documentation, technological advancement in cartography, cultural representation shifts, and trade route evolution mapping. These components enable presenters to demonstrate Asia's dynamic territorial development, colonial impact on regional borders, and cartographic innovation progression, with many educational institutions and cultural organizations finding that combining historical context with visual map comparisons delivers comprehensive understanding and enhanced audience engagement.
Interactive maps enhance Asia's geopolitical landscape understanding by enabling dynamic visualization of territorial boundaries, trade relationships, economic zones, and strategic partnerships through clickable regions and layered data overlays. These tools allow presenters to seamlessly navigate between country-specific demographics, regional alliances, and economic indicators, while audience members can explore complex relationships between nations like ASEAN partnerships or Belt and Road initiatives, ultimately delivering more engaging and comprehensive geopolitical insights.
Asian countries often depict disputed territories differently on maps, with China showing the nine-dash line in the South China Sea, India including all of Kashmir, and Japan marking the Kuril Islands as Japanese territory. These cartographic choices reflect national sovereignty claims and territorial disputes, with many organizations finding that understanding these variations is crucial for accurate regional analysis, diplomatic communications, and strategic business planning across diverse Asian markets.
Cultural factors shape Asian map representation through varying cartographic traditions, religious symbolism, historical perspectives, political boundaries, and geographic emphasis priorities. These influences manifest in different projection choices, landmark prioritization, and territorial representations, with many regional cartographers finding that incorporating local cultural contexts enhances map relevance and user engagement across diverse Asian communities.
Technological advancements transforming Asian mapping include GPS satellite systems, GIS software, drone surveying, real-time data integration, and mobile mapping applications. These technologies streamline cartographic accuracy by enabling precise coordinate mapping, automated data collection, and instant updates, with logistics companies, urban planners, and government agencies finding enhanced operational efficiency and strategic decision-making capabilities.
Data visualization techniques for Asian demographic information include heat maps, choropleth maps, population pyramids, density overlays, and interactive dashboards with filtering capabilities. These methods enhance understanding by highlighting population distributions, age structures, and migration patterns across diverse regions like Southeast Asia and East Asia, while enabling policymakers and researchers to identify trends, allocate resources strategically, and make data-driven decisions for increasingly complex demographic challenges.
Common misconceptions include Asia being a single cultural entity, China and India dominating all regions equally, deserts covering most landmasses, and uniform climate patterns across countries. These oversimplifications can undermine presentation credibility, with many organizations finding that accurate geographical context enhances stakeholder understanding, strengthens regional business strategies, and ultimately delivers more effective cross-cultural communications and market positioning.
Climate and natural resources significantly influence Asian cartographic representations through specialized thematic mapping, topographical detail emphasis, and resource distribution visualization. These maps enable governments, businesses, and researchers to make strategic decisions about agricultural development, mining operations, and infrastructure planning, with many organizations finding that detailed climate and resource mapping delivers enhanced regional planning, improved investment targeting, and ultimately stronger economic development across diverse Asian markets.
Maps serve as powerful symbols of territorial sovereignty, cultural heritage, and historical narratives that reinforce national pride and unity across Asian nations. Through educational curricula, diplomatic communications, and public displays, countries like China, India, and Japan strategically utilize cartographic representations to strengthen citizen connection to homeland boundaries, while fostering shared cultural identity and supporting broader nation-building initiatives.
Educators can use Asia maps to foster geographic literacy by encouraging spatial reasoning, cultural connections, regional comparisons, and interactive learning activities. Through physical and political maps, students explore diverse landscapes, major cities, and cultural regions while developing critical thinking skills, ultimately enhancing their understanding of global interconnectedness and Asia's strategic importance in today's economy.
**INPUT**: What are the ethical considerations to keep in mind when creating politically sensitive maps of Asia? **OUTPUT**: Ethical considerations include accurate territorial representation, cultural sensitivity, avoiding political bias, respecting disputed boundaries, and acknowledging indigenous communities. These principles enhance credibility by ensuring balanced perspectives, minimizing regional tensions, and promoting inclusive storytelling, with many organizations finding that thoughtful cartographic practices ultimately deliver stronger stakeholder trust and broader audience acceptance.
Tourism maps of Asia prioritize visitor attractions, transportation routes, accommodation options, and cultural highlights, while scholarly geographic maps focus on topographical features, political boundaries, demographic data, and scientific classifications. Tourism maps use vibrant colors, simplified layouts, and visual icons to enhance readability for travelers, whereas academic maps emphasize precision, detailed cartographic standards, and comprehensive data visualization, with many tourism boards finding that accessible design ultimately delivers better visitor experiences and navigation efficiency.
Digital mapping technologies enhance preservation of traditional Asian maps through high-resolution scanning, cloud storage, digital archives, and interactive platforms that ensure long-term accessibility. These technologies enable museums, universities, and cultural institutions across Asia to digitize historical cartographic collections, create searchable databases, and share rare maps globally, while ultimately delivering broader educational access and protecting irreplaceable cultural heritage from physical deterioration.
Historical maps of Asia reveal evolving territorial boundaries, trade routes, colonial influences, and demographic shifts that directly inform contemporary regional disputes. These visual records help stakeholders understand root causes of current tensions, from Kashmir's partition legacy to South China Sea territorial claims, while enabling policymakers, educators, and diplomats to frame discussions with deeper historical context, ultimately facilitating more informed dialogue and strategic decision-making.
Effective visualization tools for Asian trade routes include interactive digital maps, GIS-enabled presentations, animated route overlays, statistical heat maps, and multi-layered geographical displays. These technologies enhance presentations by streamlining complex data visualization, enabling dynamic storytelling, and facilitating audience engagement, with many organizations finding that strategic visual integration ultimately delivers clearer insights and more compelling trade analysis outcomes.
-
The best and engaging collection of PPTs I’ve seen so far. Great work!
-
I've been looking for a good template source for some time. I'm happy that I discovered SlideTeam. Excellent presentations must try!