

Best Practices For Handling Skewed Data Askew PPT Presentation ACP





Try Before you Buy Download Free Sample Product
 Impress Your
Audience
 100%
Editable
 Save Hours
of Time


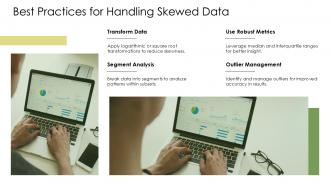
Unlock the secrets to effective data analysis with our Best Practices for Handling Skewed Data PowerPoint presentation. This comprehensive deck equips professionals with essential strategies, techniques, and insights to accurately interpret skewed datasets, ensuring informed decision making and enhanced data driven results. Perfect for analysts and decision makers alike.
People who downloaded this PowerPoint presentation also viewed the following :
Best Practices For Handling Skewed Data Askew PPT Presentation ACP with all 9 slides:
Use our Best Practices For Handling Skewed Data Askew PPT Presentation ACP to effectively help you save your valuable time. They are readymade to fit into any presentation structure.








FAQs for Best Practices For Handling Skewed Data Askew
Common causes of skewed data include outliers, natural distribution patterns, measurement errors, sampling bias, and external constraints like minimum wage floors or age restrictions. These factors often reflect real-world business scenarios, with financial datasets, customer behavior analytics, and operational metrics frequently exhibiting skewness, ultimately requiring strategic preprocessing approaches to unlock meaningful insights for competitive advantage.
Skewed data can significantly distort statistical analyses by shifting mean values away from typical observations, inflating variance estimates, and violating assumptions underlying parametric tests like t-tests and ANOVA. This leads to misleading conclusions in business applications, with many organizations finding that skewed customer spending patterns, sales distributions, or performance metrics can result in flawed forecasting models and poor strategic decisions.
Techniques for detecting skewness include visual methods like histograms, box plots, and Q-Q plots, alongside statistical measures such as skewness coefficients, the Shapiro-Wilk test, and Kolmogorov-Smirnov tests. These approaches enable data scientists across industries like finance, healthcare, and retail to identify distribution patterns early, streamline preprocessing workflows, and ultimately deliver more accurate predictive models and reliable business insights.
Transforming skewed data offers advantages including improved model performance, enhanced statistical validity, better visualization clarity, and reduced impact of outliers on analysis accuracy. However, it presents challenges including potential loss of data interpretability, increased complexity in explaining results to stakeholders, and risk of over-correction, with many organizations finding that strategic transformation approaches ultimately deliver more reliable insights and competitive analytical advantage.
Outliers significantly contribute to data skewness by pulling the distribution's tail toward extreme values, creating asymmetrical patterns that distort statistical measures like mean and standard deviation. In sectors like banking and healthcare, these extreme data points can skew risk assessments and patient outcome analyses, ultimately requiring robust preprocessing techniques to ensure accurate modeling and reliable business insights.
Data visualization serves as the primary diagnostic tool for identifying skewed data through histograms, box plots, Q-Q plots, and density curves that reveal distribution asymmetries. These visual methods enable data scientists and analysts to quickly spot outliers, assess normalization needs, and determine appropriate statistical transformations, with many organizations finding that early visual detection streamlines data preprocessing and enhances model accuracy.
Normalization and standardization help handle skewed data by transforming distributions to reduce the impact of extreme values, improving model performance, and enabling fair feature comparison across different scales. While these techniques don't eliminate skewness entirely, they minimize its effects on algorithms sensitive to data distribution, with many organizations finding that standardized features enhance predictive accuracy and reduce computational bias in machine learning applications.
Statistical methods for skewed datasets include log transformations, square root transformations, Box-Cox transformations, robust statistical measures like median and interquartile range, and non-parametric tests such as Mann-Whitney U and Kruskal-Wallis. These approaches enable organizations across finance, healthcare, and retail to extract meaningful insights from asymmetric data distributions, while minimizing bias and enhancing analytical accuracy, ultimately delivering more reliable business intelligence and strategic decision-making capabilities.
Selecting the right measure of central tendency for skewed data ensures accurate representation of your dataset's typical values, with median often being more reliable than mean in heavily skewed distributions. This choice significantly impacts business decisions, statistical analyses, and data interpretations across sectors like finance and healthcare, ultimately delivering more precise insights and preventing misleading conclusions that could affect strategic planning.
Skewness can significantly impact machine learning model performance by causing algorithms to favor majority classes, creating biased predictions, and reducing overall accuracy in classification tasks. Many financial institutions and healthcare organizations find that highly skewed datasets lead to poor minority class detection, affecting critical applications like fraud detection and rare disease diagnosis, ultimately compromising model reliability and business outcomes.
Mitigating skewed data effects involves transformation techniques like log scaling, square root functions, and Box-Cox normalization, along with resampling methods such as SMOTE and undersampling. These approaches enhance model accuracy by creating balanced datasets, improving feature distributions, and reducing prediction bias, with many organizations finding that strategic data preprocessing ultimately delivers more reliable insights and competitive analytical advantage.
Skewness significantly influences regression technique selection by affecting assumption validity, with right-skewed data often requiring log transformations or robust methods like quantile regression instead of standard linear approaches. Financial institutions analyzing loan default patterns and healthcare organizations examining patient treatment costs frequently find that addressing skewness through appropriate technique selection delivers more accurate predictions and reliable statistical inferences, ultimately enhancing decision-making quality.
Skewed data commonly occurs in financial services with income distributions and loan default rates, healthcare with patient wait times and treatment costs, retail with customer purchase amounts and inventory turnover, and telecommunications with call duration and data usage patterns. These industries leverage statistical techniques like log transformations and robust algorithms to handle asymmetric distributions, ultimately enabling more accurate predictive modeling, risk assessment, and operational decision-making for competitive advantage.
Data bucketization and stratification address skewness by redistributing data points into more balanced groups, creating uniform intervals that reduce the impact of extreme values and outliers. Through strategic segmentation, organizations in sectors like retail analytics and financial risk assessment can achieve more stable model performance, improved statistical accuracy, and enhanced predictive capabilities, ultimately delivering clearer insights for decision-making processes.
When reporting results from skewed data analyses, best practices include clearly documenting data transformations applied, reporting both original and transformed statistics, using appropriate non-parametric measures like medians and interquartile ranges, and providing visual representations that accurately show distribution shapes. These approaches enhance transparency and credibility by giving stakeholders complete context, enabling better decision-making across sectors like healthcare outcomes reporting and financial risk assessments, ultimately delivering more reliable insights.
-
A library of engaging, customizable and content-ready templates.
-
I’m not a design person, so I couldn’t make a presentation to save my life. Thankfully, they have all kinds of templates that I regularly use for my work.