

BI For Human Resource Management Powerpoint Presentation Slides






Try Before you Buy Download Free Sample Product
 Impress Your
Audience
 100%
Editable
 Save Hours
of Time


BI uses business analytics, data mining, data visualization, and best practices to help enterprises make more data-driven and effective decisions. Modern BI solutions facilitate the comprehensive view of an organizations data and use that data to drive change and eliminate inefficiencies in the business procedure. Our deck BI for human resource management shows the implementation of business intelligence to enhance the HR operations of an organization. This deck showcases the key challenges faced by enterprises that lack effective BI solutions. It provides an overview of the benefits and practices for implementing BI. It includes key business intelligence trends and architectural frameworks of business intelligence for modern businesses. This deck covers the procedure to effectively implement BI in HR operations. It includes details related to the comparison of BI tools and the selection of the best tool based on its key attributes. Lastly, it covers the roles and responsibilities of the BI implementation team, the budget allocated for implementing business intelligence in HR operations, and the impact of BI implementation on business operations pre and post-implementation. Download our template now.
People who downloaded this PowerPoint presentation also viewed the following :
Content of this Powerpoint Presentation
Slide 1: This slide introduces BI For Human Resource Management. State your company name and begin.
Slide 2: This slide states Agenda of the presentation.
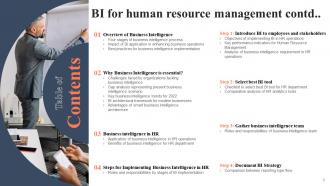
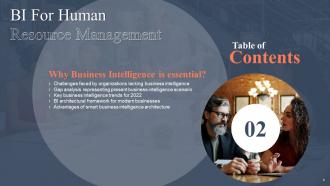
Slide 3: This slide shows Table of Content for the presentation.
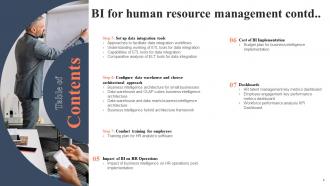
Slide 4: This is another slide continuing Table of Content for the presentation.
Slide 5: This slide highlights title for topics that are to be covered next in the template.
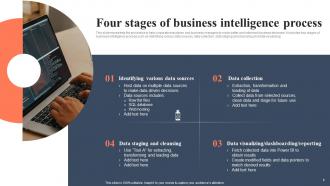
Slide 6: This slide represents four stages of business intelligence process.
Slide 7: This slide represents Impact of BI application in enhancing business operations.
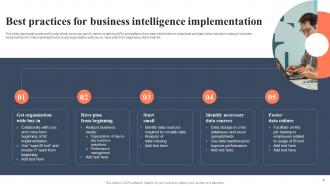
Slide 8: This slide represents Best practices for business intelligence implementation.
Slide 9: This slide highlights title for topics that are to be covered next in the template.
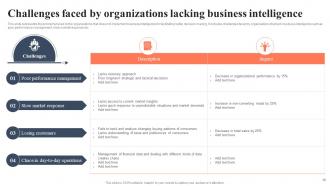
Slide 10: This slide represents Challenges faced by organizations lacking business intelligence.
Slide 11: This slide represents the gap analysis to help organizations to build effective strategies to eliminate these gaps and achieve desired results.
Slide 12: This slide represents Key business intelligence trends for 2022.
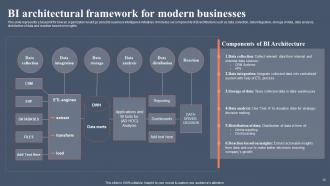
Slide 13: This slide represents a blueprint for how an organization would go about its business intelligence initiatives.
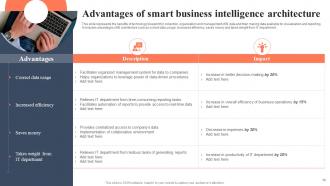
Slide 14: This slide represents the Advantages of smart business intelligence architecture.
Slide 15: This slide highlights title for topics that are to be covered next in the template.
Slide 16: This slide represents the various ways in which business intelligence is applied in human resource operations.
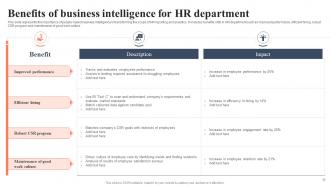
Slide 17: This slide represents the importance of people-based business intelligence in transforming the scope of HR reporting and analytics.
Slide 18: This slide highlights title for topics that are to be covered next in the template.
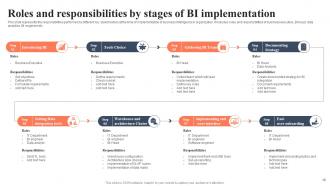
Slide 19: This slide represents the responsibilities performed by different key stakeholders at the time of implementation of business intelligence in organization.
Slide 20: This slide highlights title for topics that are to be covered next in the template.
Slide 21: This slide represents the goals that are to be achieved by the HR department through the implementation of Business intelligence in HR operations.
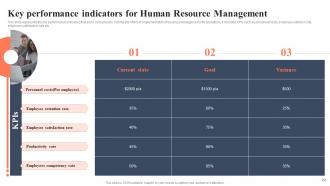
Slide 22: This slide represents the key performance indicators that are to be tracked to monitor the effect of implementation of business intelligence in HR operations.
Slide 23: This slide represents the need for implementing business intelligence in HR operations.
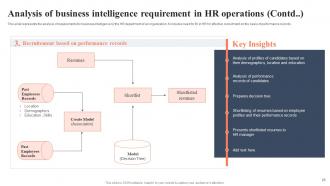
Slide 24: This slide represents the analysis of need for implementation of BI in HR operations.
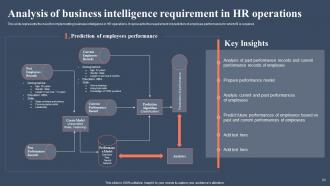
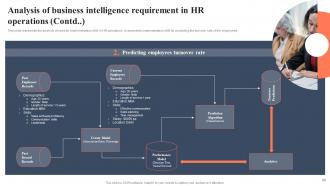
Slide 25: This slide represents the analysis of requirements for business intelligence by the HR department of an organization.
Slide 26: This slide highlights title for topics that are to be covered next in the template.
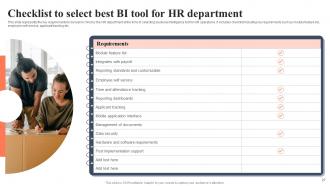
Slide 27: This slide represents the key requirements to be kept in mind by the HR department at the time of selecting business intelligence tool for HR operations.
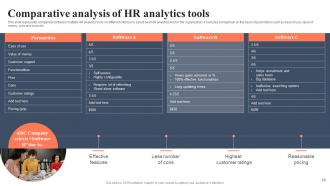
Slide 28: This slide represents comparison between multiple HR analytics tools on different criteria's to select best HR analytics tool for the organization.
Slide 29: This slide highlights title for topics that are to be covered next in the template.
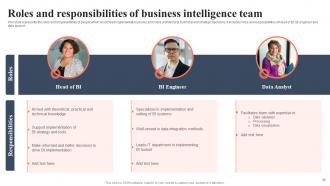
Slide 30: This slide represents the roles and responsibilities of people which would lead implementation proves and make architectural, technical and strategic decisions.
Slide 31: This slide highlights title for topics that are to be covered next in the template.
Slide 32: This slide represents the difference between the types of data reporting flow.
Slide 33: This slide highlights title for topics that are to be covered next in the template.
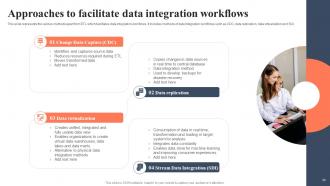
Slide 34: This slide represents the various methods apart from ETL which facilitates data integration workflows.
Slide 35: This slide represents the workflow of ETL tools which allows businesses to consolidate data from various databases into single repository.
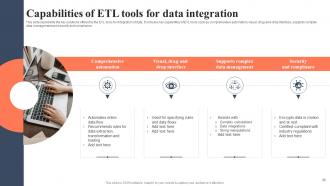
Slide 36: This slide represents the key solutions offered by the ETL tools for integration of data.
Slide 37: This slide represents comparison between various ETL tools to help organization select the best ETL tool for integrating data.
Slide 38: This slide highlights title for topics that are to be covered next in the template.
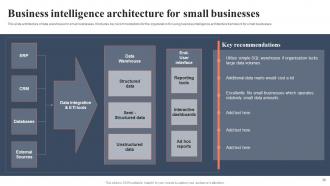
Slide 39: This slide architecture of data warehouse for small businesses.
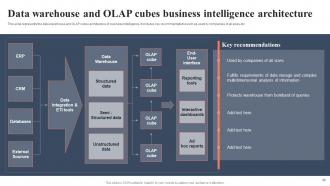
Slide 40: This slide represents the data warehouse and OLAP cubes architecture of business intelligence.
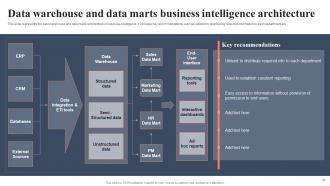
Slide 41: This slide represents the data warehouse and data marts architecture of business intelligence.
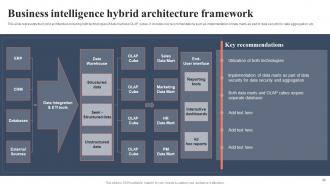
Slide 42: This slide represents the hybrid architecture including both technologies of data mart and OLAP cubes.
Slide 43: This slide highlights title for topics that are to be covered next in the template.
Slide 44: This slide represents the plan prepared for facilitating training to employees related to usage of implemented business intelligence software.
Slide 45: This slide highlights title for topics that are to be covered next in the template.
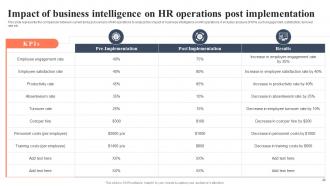
Slide 46: This slide represents the comparison between current and past scenario of HR operations to analyze the impact of business intelligence on HR operations.
Slide 47: This slide highlights title for topics that are to be covered next in the template.
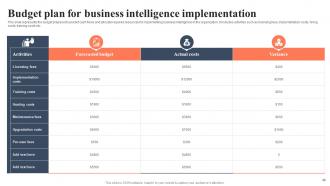
Slide 48: This slide represents the budget prepared to predict cash flows and allocate required resources for implementing business intelligence in the organization.
Slide 49: This slide highlights title for topics that are to be covered next in the template.
Slide 50: This slide represents the KPI dashboard to track and monitor management of talent by the HR department.
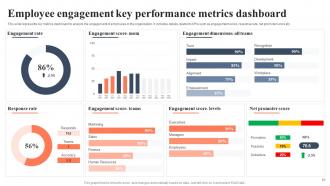
Slide 51: This slide represents key metrics dashboard to analyze the engagement of employees in the organization.
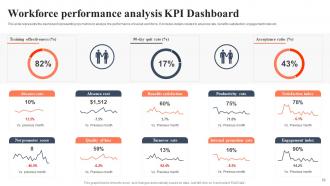
Slide 52: This slide represents the dashboard representing key metrics to analyze the performance of overall workforce.
Slide 53: This slide contains all the icons used in this presentation.
Slide 54: This slide is titled as Additional Slides for moving forward.
Slide 55: This is Our Target slide. State your targets here.
Slide 56: This slide contains Puzzle with related icons and text.
Slide 57: This is an Idea Generation slide to state a new idea or highlight information, specifications etc.
Slide 58: This slide shows Post It Notes. Post your important notes here.
Slide 59: This is About Us slide to show company specifications etc.
Slide 60: This slide shows SWOT describing- Strength, Weakness, Opportunity, and Threat.
Slide 61: This is a Thank You slide with address, contact numbers and email address.
BI For Human Resource Management Powerpoint Presentation Slides with all 66 slides:
Use our BI For Human Resource Management Powerpoint Presentation Slides to effectively help you save your valuable time. They are readymade to fit into any presentation structure.























FAQs for BI For Human Resource Management
Start with the basics: turnover rate, time-to-hire, and cost-per-hire. Leadership actually gives a damn about these numbers. Then add engagement scores, absenteeism, and training ROI. Diversity metrics matter too, obviously. Here's the thing though - I've seen way too many HR teams drown themselves tracking like 20 different metrics. It's honestly exhausting. Stick to maybe 6-8 KPIs that actually connect to your company's goals. Set up some automated dashboards so you're not pulling reports manually every month (learned that the hard way). Review trends monthly before small issues turn into dumpster fires.
Honestly, BI tools are pretty clutch for this. They pull data from surveys, performance stuff, even Slack - then show it all in real-time dashboards. You'll spot issues way earlier, like when one team's satisfaction tanks after a bad meeting or whatever. The visual stuff actually shows what drives engagement (spoiler: definitely not free snacks). Break it down by department or how long people have worked there to get better insights. Oh, and you can set alerts when scores drop too low, so you're not scrambling after half your team already quit.
So basically, predictive analytics looks at your past hiring data and turnover rates to figure out when you'll need new people. Pretty neat stuff - I've seen some models get scary accurate! Pull your last 2-3 years of hiring and turnover info, that's usually enough to start. You can spot which roles lose people the most, catch seasonal patterns, and see skill gaps coming before they bite you. Honestly beats scrambling to fill positions last minute. The whole thing helps you budget better and plan your recruitment timeline way ahead of time.
Dude, BI dashboards are a game changer for HR stuff. You get all your metrics in one spot - turnover, hiring pipeline, engagement scores, pay analysis, whatever. No more drowning in Excel hell (trust me, been there). Real-time data means you can actually spot problems fast instead of just guessing. Like if one team keeps losing people or recruiting's dragging on forever. I'd say pick your biggest 3-4 headaches first and build dashboards around those. Way easier than trying to track everything at once. The visual charts make patterns super obvious too.
Honestly, visualizing your HR data is a game changer - turns those endless spreadsheet rows into something you can actually work with. Spot turnover trends instantly, see which teams are struggling with engagement, track how your hiring funnel's performing. Way faster than digging through raw numbers for hours. Leadership eats this stuff up too (who doesn't love a good chart, right?). My advice? Start basic - bar charts, line graphs, that kind of thing. You can get all fancy with heat maps later once you've got the hang of it. The trick is matching the right visual to whatever metric you're trying to show.
So BI basically lets you compare what skills your team has now versus what you'll need down the road. It digs through employee data, training records, performance stuff - gives you the full picture of gaps before they bite you. Honestly, it's pretty slick how it works. The system tracks certifications, spots which departments are missing key skills, and can even predict shortages based on turnover trends. My advice? Clean up your skills inventory data first - garbage in, garbage out, you know? Then run your gap analyses. Way better than guessing what training to invest in.
Ugh, data silos are the worst - your HR info is spread across like five different systems. Privacy regulations make everything complicated too since you're dealing with employee data. Leadership won't always see the point right away because HR analytics doesn't scream "instant money maker." Plus finding someone who actually gets both HR and data analysis? Good luck with that. Data quality will probably drive you nuts at some point. Honestly though, just pick something simple to start with - maybe predicting who's about to quit. Once you show that works, you can tackle bigger stuff.
Honestly, BI shows you where your hiring money's actually working vs. just getting wasted. Track which job boards give you people who stick around - I've seen companies discover their expensive "premium" postings brought in the worst hires! You'll spot red flags before people quit and figure out what benefits your team actually cares about. The data reveals crazy patterns, like how some managers lose way more people than others. Oh, and map out your hiring process first - then start tracking how happy employees are over time. Trust me, you'd never catch these trends just by guessing.
Track ROI by comparing performance before/after training programs - also look at retention rates between trained vs untrained people. Completion rates and assessment scores tell you a lot too. Honestly, you'll be surprised how often the pricey courses don't actually boost productivity much compared to simpler methods. Connect your LMS data to performance reviews first - that's where the good patterns show up. You can spot skill gaps by department pretty easily this way. Time-to-competency metrics are super useful for figuring out which training methods actually work vs just look impressive on paper.
Honestly, BI integration will save you so much hassle with data collection. No more pulling reports from different systems and trying to make sense of everything. Real-time dashboards sync it all automatically, which is pretty sweet. Your team stops wasting hours on data entry and can focus on the actual strategic stuff instead. Plus when your boss asks those random questions, you'll actually have answers ready. I'd say look at whatever reports you're creating most often - that's where you want to start automating first. Trust me, once you see those trends pop up automatically, you won't want to go back.
So BI tracks all your compliance stuff automatically - work hours, overtime limits, breaks, wages, the whole deal. You can set alerts that catch potential violations before they happen, which honestly saves your ass during audits since everything's already documented. The dashboards show you patterns too, like if certain teams keep screwing up specific regulations. Oh and definitely set up those automated reports now - trust me, you don't want to be frantically pulling data when inspectors show up. Makes the whole process way less stressful.
Start with role-based access - people only see what they need for their jobs. Everything needs encryption, both stored and moving around. Your BI platform better comply with GDPR and privacy regs too. Here's what freaks me out though: dashboards accidentally leak sensitive info SO easily! Anonymize personal data whenever you can, especially for big-picture analytics. Audit trails are clutch - track who saw what and when. Oh, and train your team properly. I've seen great security setups totally ruined because someone carelessly shared a dashboard link.
So instead of waiting around for those yearly reviews, BI tools show you what's happening right now with your team. Track sales, project completions, attendance - whatever matters for each role. Honestly, the dashboards are pretty sweet for spotting patterns. Like you'll see who's crushing it versus where things are lagging. Set up alerts too so you know immediately when someone's numbers drop. The real game-changer? You're not just going off hunches anymore - you've got actual data. My advice: pick 2-3 metrics that really count for each position, then build everything around those. Don't overcomplicate it.
Dude, real-time data changes everything for HR. No more waiting weeks for reports while good people slip through the cracks. You'll catch engagement issues as they're happening and spot who's about to quit before they do. Way better than those useless quarterly reviews, honestly. The difference is huge - you're actually preventing problems instead of scrambling after someone's already handed in their notice. Just make sure your dashboards show stuff that actually helps you make decisions day-to-day, not just flashy graphics that impress the C-suite but don't tell you anything useful.
Honestly, BI is a game-changer for measuring diversity instead of just wing-it guessing. Track your hiring patterns, promotion rates, pay gaps across demographics - you'll spot bias way faster. Those dashboards show if you're recruiting from the same boring places or if people get stuck at certain levels. The best part? You can actually see if those diversity trainings work (spoiler: half don't). I'd start with basic diversity metrics reporting first - sounds boring but you need real data to make smart moves, not just gut feelings.
-
Amazing variety of PowerPoint slides. Really helpful in designing professional presentations.
-
Use of icon with content is very relateable, informative and appealing.