



 0 Comment
 Customer Reviews

Have you ever been in a meeting where the numbers don’t match, everyone has a different set of numbers to show, and nobody has an idea which one is correct? Confusion like this hinders decision-making. A Business Insights Dashboard will eliminate that confusion. It will give you and your team a single, clear, and timely version of the truth.
A Business Intelligence Dashboard template from SlideTeam takes messy and complicated data from across sales, marketing, finance, and operations and distills that into smart and timely information that will allow you to take action with confidence.
In today’s fast-paced world, data is indeed your greatest asset but only if you know how to utilize it. The insight dashboard turns your raw data into clear, actionable stories. From monitoring performance metrics to identifying underlying patterns, it can be your organization’s performance insights tool, creating smarter and faster decisions.
What makes SlideTeam’s Business Intelligence Dashboard templates powerful for decision-makers?
| Factor | Why It Stands Out |
|---|---|
| Data Integration | Brings data from different systems together for a complete business overview. |
| Interactive Visualization | Converts raw numbers into charts and graphs that are easy to understand. |
| Real-Time Reporting | Provides up-to-the-minute insights for quick and informed decisions. |
| Goal Monitoring | Tracks company performance against key business objectives and KPIs. |
| Scalable Solutions | Grows with your organization and adapts to changing data needs. |
SlideTeam's Business analytics Dashboard Templates will help you transform complex data into simple stories that anyone can understand. Whether you want real-time analytics to monitor live performance, data-driven insights to create smarter strategies, or executive insights to make confident decisions in the boardroom, you will find it here.
Let’s explore few templates
Template 1: Dynamic Attrition Dashboard Template For Business Insights PPT
This PPT bundle prepared by SlideTeam is a valuable source for monitoring employee turnover and its effects. The bundle describes attrition rates by department, tenure, gender and exit reason. This PPT also features slides such as joining versus exits, attrition costs and methods for prevention. This dashboard provides HR leaders with clarity and direction. Use it to identify risk hotspots, report actionable findings, and coordinate organization with retention strategies.

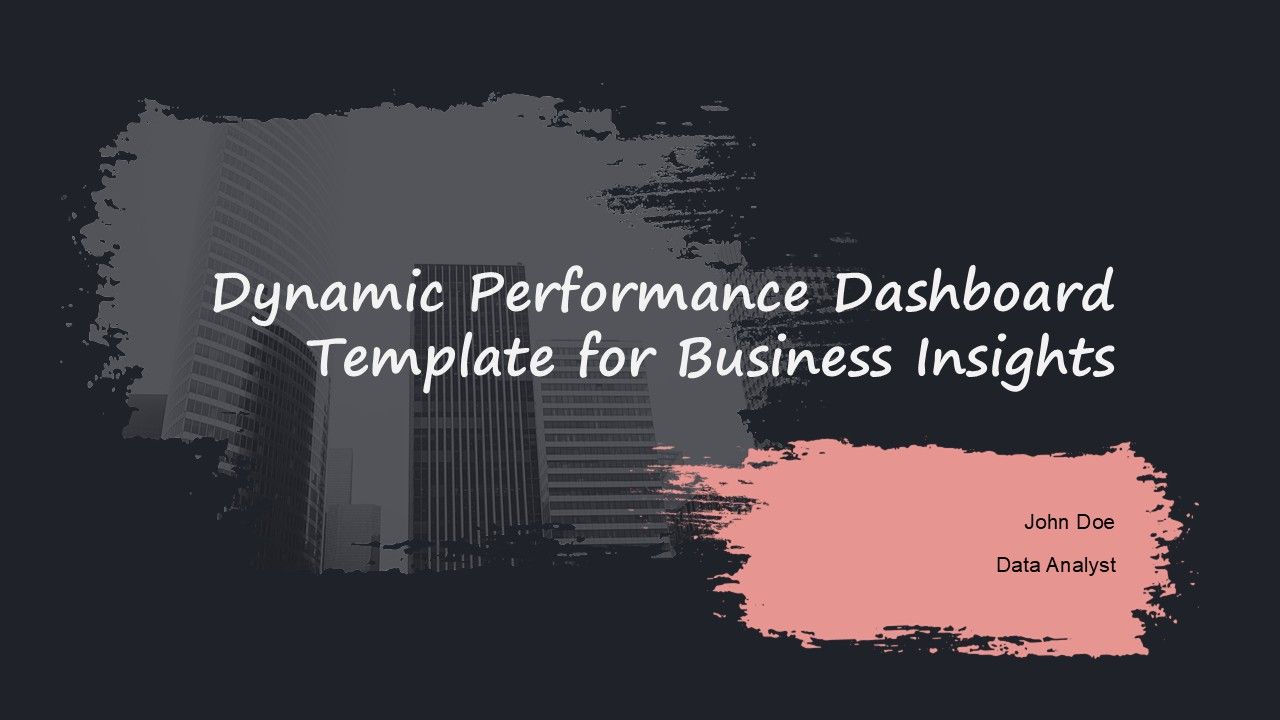
Template 2: Dynamic Performance Dashboard Template For Business Insights PPT
SlideTeam offers you a pre-made PowerPoint template to assist you in presenting business performance data in a structured and compelling way. It covers key areas including KPI tracking, data visualization, trend analysis, and real-time data integration, as well as principles of dashboard design. The template also includes addressing data integration, user-centered design, security, automation, and advanced analytics, therefore it is an invaluable resource for organizations that need to transform their raw data into relevant insights which can drive more effective decision making and strategic planning. Download now!
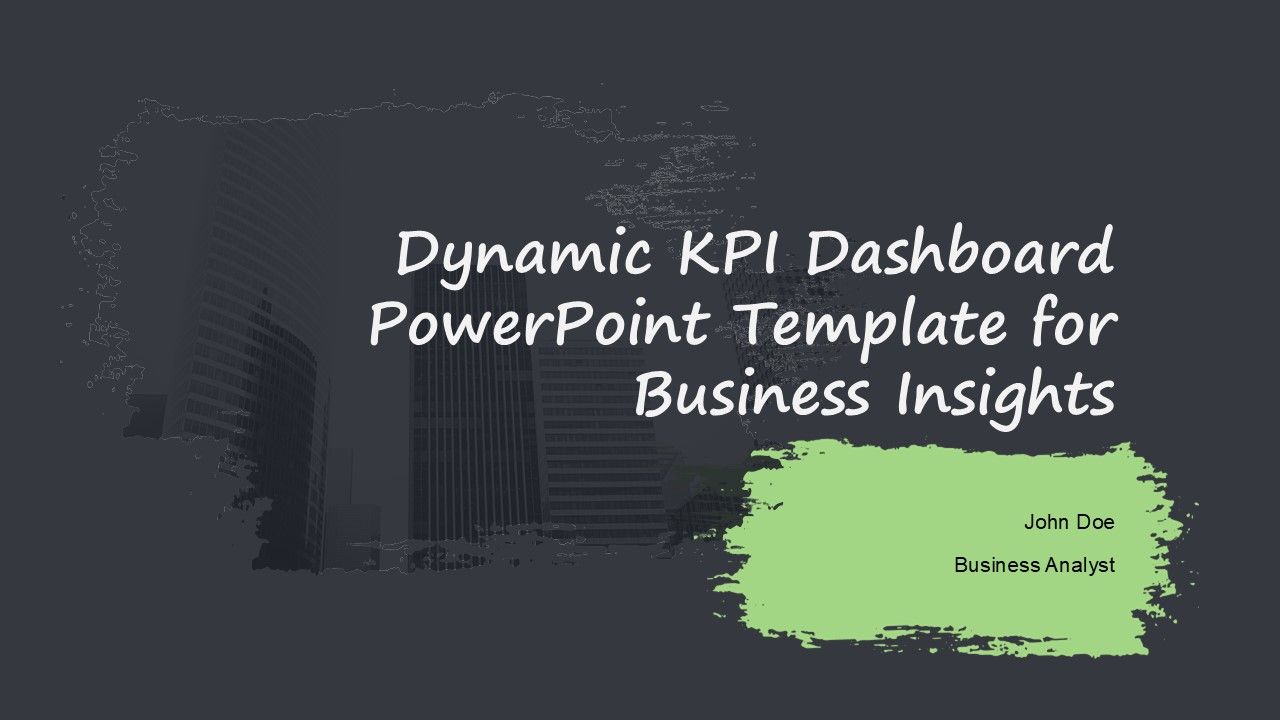
Template 3: Dynamic KPI Dashboard PowerPoint Template For Business Insights PPT
Here is a SlideTeam PPT template designed for businesses who need to measure and analyze important performance indicators to measure results. It will cover KPI tracking, data visualizations, real-time analytics, dashboard design principles, performance assessment, etc. Use this deck to evaluate financial, operational, and customer indicators, discover areas for improvement, and use evidence and insights to inform, enhance, and strengthen your strategies related to the business. Download now!
Template 4: Transportation KPI Dashboard Template For Business Insights PPT
Use this SlideTeam PPT template to gain effective insights regarding the transportation efficiency and performance within your organization. It encompasses KPI metrics, such as cost efficiency, on-time deliveries, fleet utilization, fuel consumption, and safety compliance. This template assess the transportation logistics performance in your organization and identify areas for cost savings and enhances route optimization performance. This tool is also necessary for data-driven transportation management and decision-making.

Template 5: Editable Production Dashboard Template For Business Insights PPT
Incorporate SlideTeam’s presentation to track and improve production performance smartly. This slide deck has all the important areas, such as real-time data, resource management, KPI assessment, and sustainability metrics like energy consumption, waste decrease and carbon footprint. This presentation also explains dashboard design, data visualization, and a feedback loop for continual improvement. Use this presentation to assess operational efficiency and to customize production performance for enhancing outcomes.

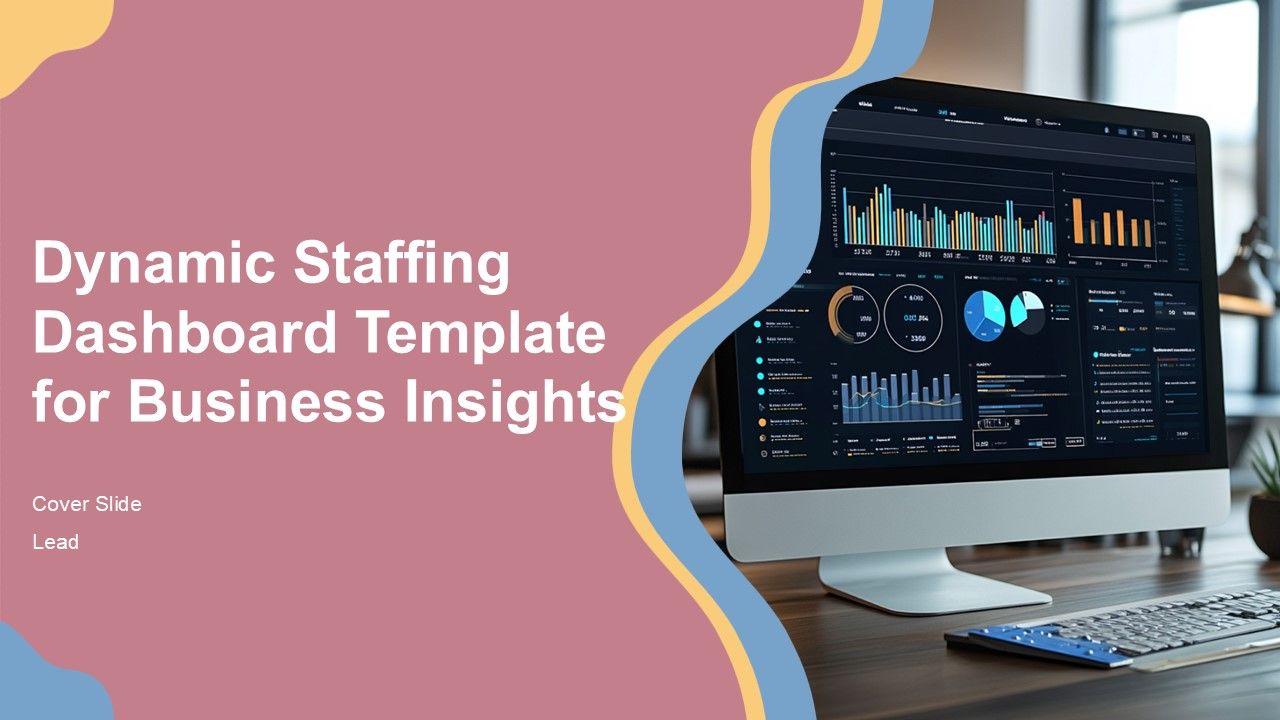
Template 6: Dynamic Staffing Dashboard Template For Business Insights PPT
Use SlideTeam’s PPT design to measure productivity or workforce performance and manage efficiency and resource allocation. This PPT design contains metrics like employee utilization, turnover rate, the pace of recruitment, and satisfaction rate. It also covers aspects of cost management, automated data tracking in real-time, and predictive staffing analysis. Deploy this presentation to monitor labor efficiency, enhance decision-making, and improve overall workforce planning through actionable insights and data visualization.
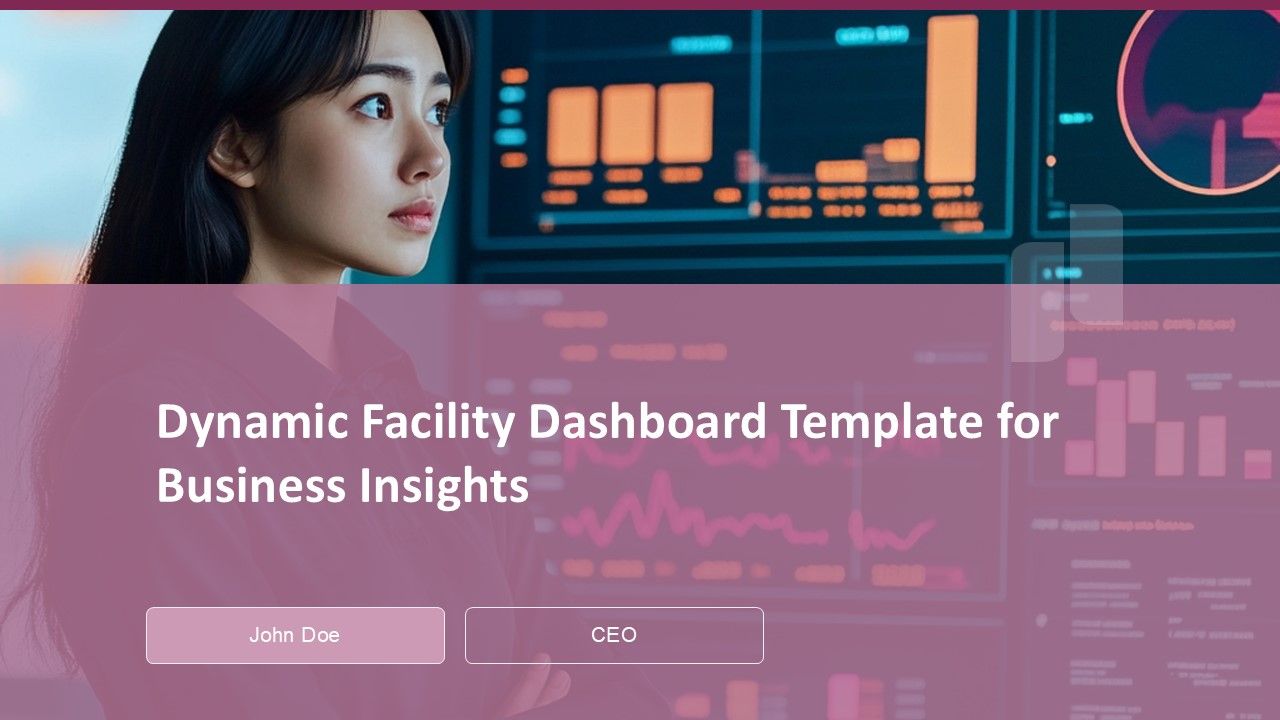
Template 7: Dynamic Facility Dashboard Template For Business Insights PPT
Download this Business Insights presentation template to gain oversight and optimize facility operations. This presentation covers essential facets of information such as data visualization, real-time monitoring, KPI monitoring, and performance metrics. Also it includes topics like dashboard design principles, user interactivity, security and data privacy, and cross-departmental sharing. This template analyzes occupancy rates, operational efficiency, and cost control while facilitating data-driven decision-making to improve the performance facility.
Template 8: Editable Project Health Dashboard Template For Business Insights PPT
Keep your projects on track with this comprehensive dashboard template designed to monitor overall project health and performance. This dashboard template supports KPI tracking, progression analysis, risk management, and resource utilization. The dashboard also supports real-time data visualization, stakeholder engagement, and performance metrics, and aids better decision making. Use it to evaluate budget, schedule, quality, and risks, ensuring successful project delivery every time.

Template 9: Professional Coffee Shop Dashboard Template For Business Insights PPT
Use this PPT layout to evaluate and enhance overall café performance. This deck will cover areas such as sales performance, customer insights, inventory management, and supplier analytics. It also highlights employee productivity, marketing campaign, loyalty program effectiveness, and the overall financial review. Use this presentation to analyze your highest peak sales periods, customer satisfaction trends, and subsequently implement data-driven choices based on your cafe's profitability and growth. Download now!

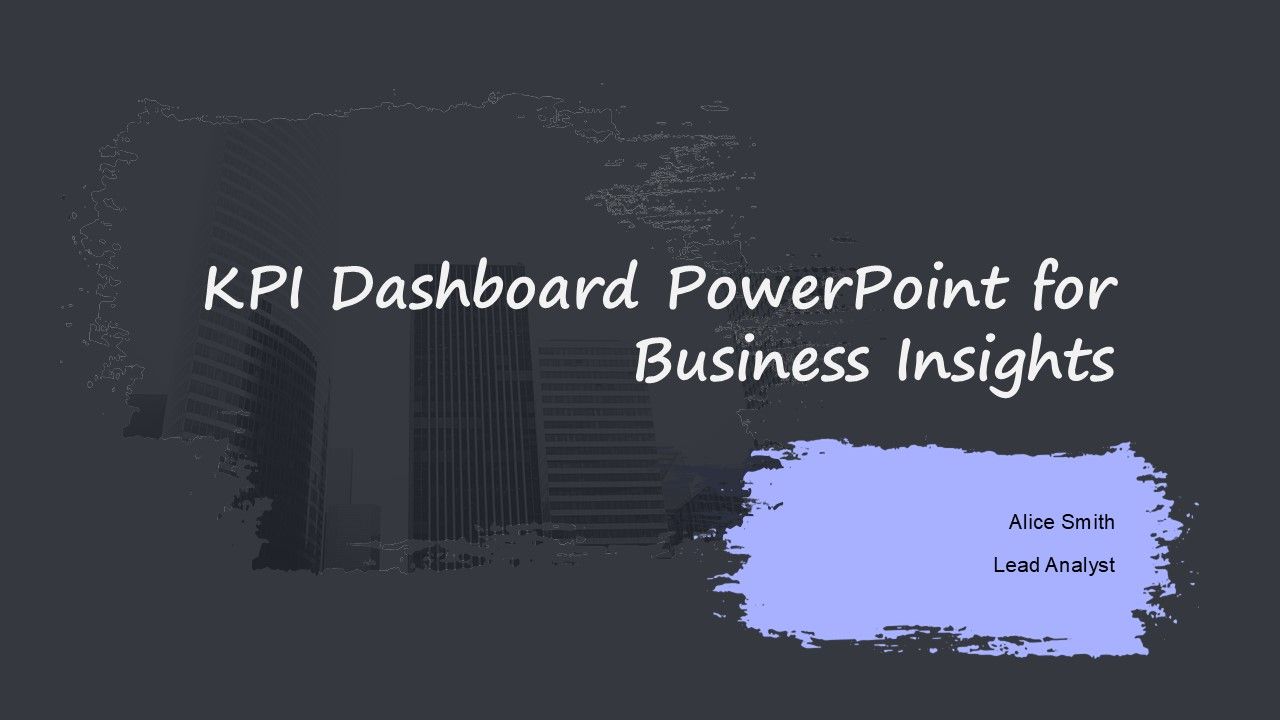
Template 10: KPI Dashboard PowerPoint For Business Insights PPT
Download this PPT to track and assess performance for various business areas. It contains sections on KPI identification, data representation, performance dashboard creation, and real-time performance tracking. It will cover topics like data integrations, performance tracking, usability & engagement , and predictive analytics. When deployed with a group, this presentation will allow your team to use data to evaluate things like sales, customer happiness, and financial performance, thereby allowing your team to make better and data-driven business decisions.
Just like data determines success, design determines impact, and with SlideTeam’s professionally designed dashboards, you can transform difficult data into easy to read insights. Present performance metrics, trends and analytics confidently and succinctly with professionally designed PPT templates.
Download now!
FAQs on Business Insight Dashboard
What is the primary purpose of a business insights dashboard?
The main goal of a business insights dashboard is to assist organizations in tracking performance, monitoring progress toward goals, and facilitating data-driven decision-making. It displays current information visually, which simplifies the process of identifying trends and strengths, and weaknesses.
Which KPIs and metrics should be included to provide actionable insights?
Essential KPIs and metrics include sales growth, revenue, profit margin, customer retention, marketing ROI, and operational efficiency. These indicators generate actionable insights to measure performance, identify gaps, and build strategic planning across different functions of the business.
How can dashboards consolidate data from multiple departments?
Dashboards bring together information from different departments and combine data from the CRM, finance, marketing, HR, and operations systems. These all-in-one views enable managers to assess performance across the organization, enhance alignment and teamwork, and develop quick, informed decisions based on solid, single-source data.