 Customer Reviews
In perhaps the world’s most famous insights that paved the way for humanity to chart uncharted waters through shipping, Archimedes’ EUREKA remains etched in the collective memory of the universe.
Businesses might not need their EUREKA moment on such a scale. The growing importance of customer service, however, requires enterprises to be profoundly insightful into their customer's needs and wants.
Insights are the foundation of the design and innovation process, serving as a guidepost for what to do next and a catalyst for creating new value for your customers. An Insights Dashboard just makes it happen for businesses, even on the scale and popularity of the likes of Apple, Google, and others.
An insights dashboard displays important information about a specific business objective of your organization and provides quick access to key features. It condenses the most important data into actionable, practical insights that businesses can exhibit in their decisions.
In the business world, insights are critical when it comes to defining strategies and driving actions designed to boost business through data. In marketing, insights are derived primarily from customer data and are used to develop campaigns, content, and customer experiences that better meet the needs of consumers and deliver value. Insights are also used to carry out customer engagement actions, such as developing buyer personas and other forms of customer segmentation.
Aside from marketing, insight can be useful in any business domain, such as optimizing a company's operations and work routines as well as its strategic and action plans. What we want an insightful dashboard to do is to offer a varied worldview from a vantage point that is different from the routine. Most businesses can manage the rest.
Explore SlideTeam's collection of insight dashboard PPT Templates and add value to your business by creating or improving it.
Template 1: Insurance Corporation Sales Insights Dashboard
Make better use of your tools with our ready-to-use insurance corporation sales insights dashboard PPT Template. Showcase your quarterly premium revenue, monthly, and overall policy status with this pre-designed layout and work in accordance with your official data to drive positive outcomes. Download this design now!

Template 2: Customer Needs Survey Insights Dashboard
Examine your target market's wants and needs to understand why it behaves the way it does with our PowerPoint Design. Use this template to have the essential details of your respondents handy such as age, gender, location, etc. This type of insight can give your business a deeper understanding of consumer behavior. Download now!

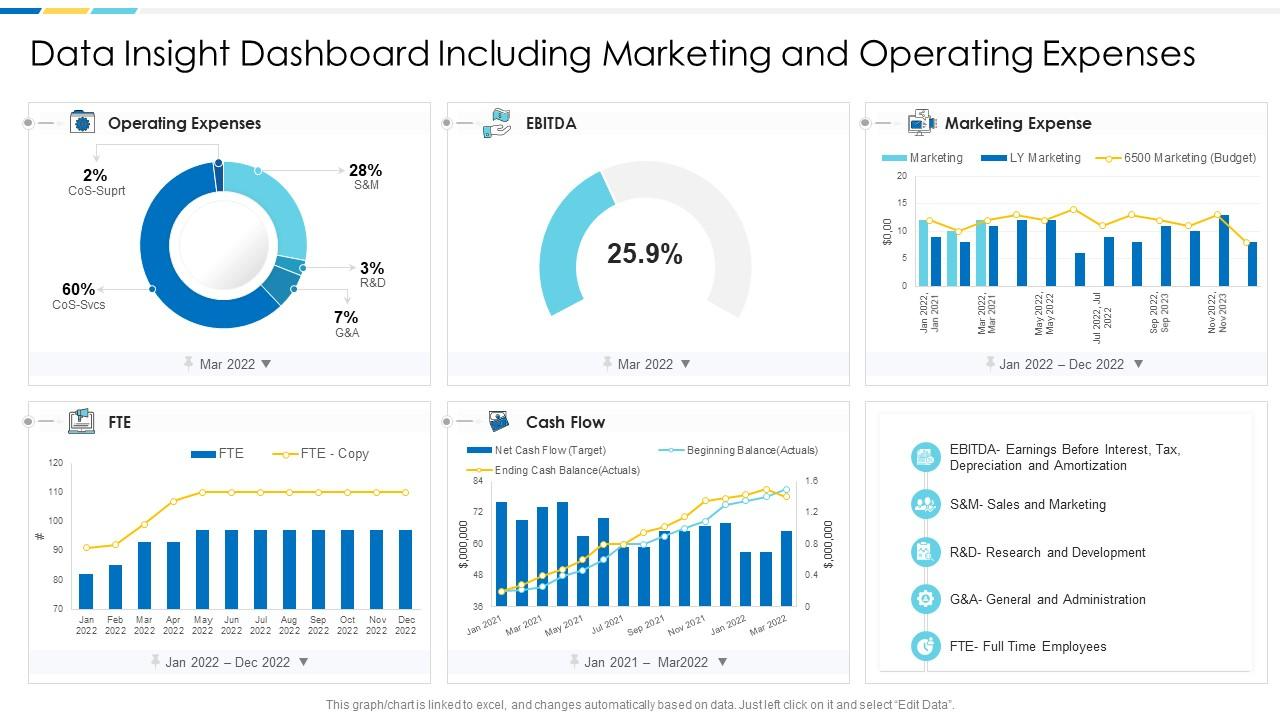
Template 3: Data Insight Dashboard PPT Template
Deploy our data insight dashboard PPT Theme and create real-time customer satisfaction. This dashboard assists you in gaining an in-depth understanding that enables organizations to make better decisions than they could if they relied solely on intuition. With this template, you can focus on operating expenses, marketing expenses, cash flow, etc. Get it right away!
Template 4: Data Insight Dashboard For Social Media Post Performance
Detecting and analyzing consumer insights from social media allows marketers to gain a better understanding of what their customers want. Our dashboard assists you with viewing the total, organic, and viral impressions in one place for better clarity on a post-performance. Collect data in real-time with our PPT Design. Grab it now!

Template 5: Facebook Page Insights Dashboard Showing Engagement Rate
Enable yourself to keep track of the Facebook page information with our insights dashboard showing the engagement rate PPT Template. Our design enables administrators to analyze trends in a page’s activity. Get well-versed with data such as daily, weekly, and monthly page reach, etc., for future measures. With this dashboard, guide operators to better understand the users. Download now!

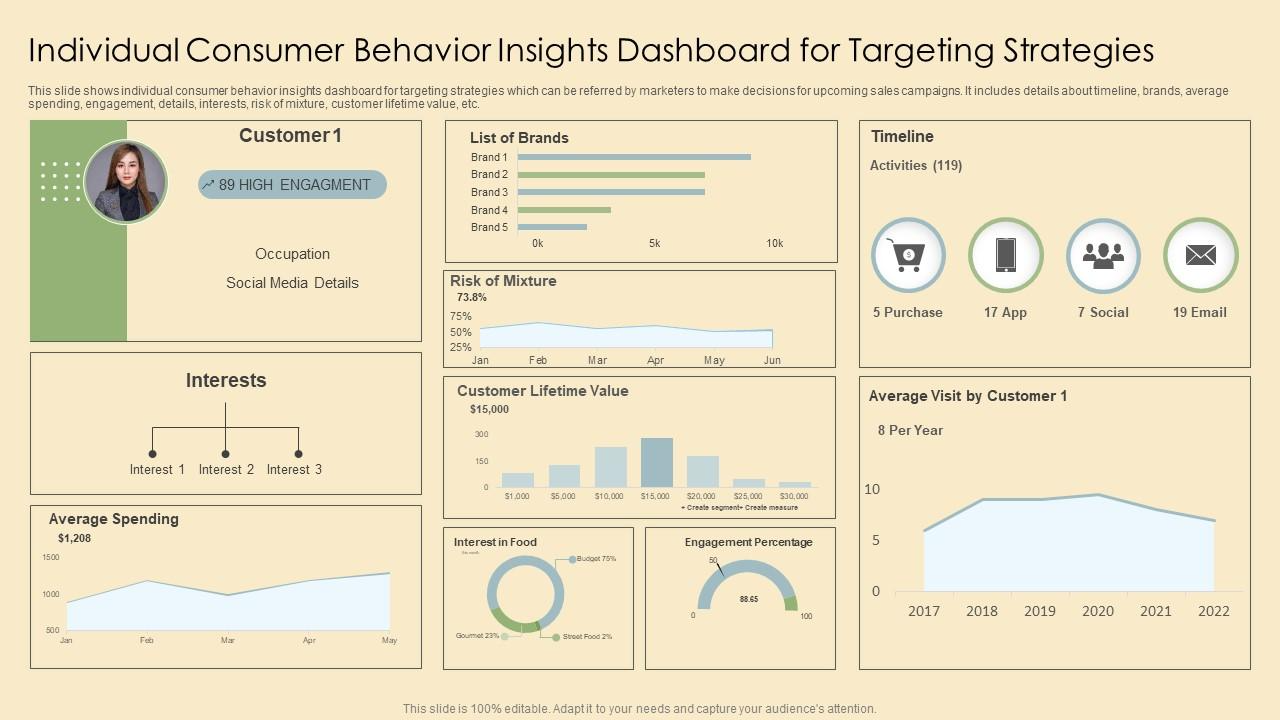
Template 6: Individual Consumer Behavior Insights Dashboard For Targeting Strategies
Deploy our individual consumer behavior insight dashboard PPT Template and make decisions for upcoming sales campaigns with utmost ease. It includes details of the timeline, brands, average spending, engagement, details, interests, risk of the mixture, customer lifetime value, etc. Improve your understanding of consumer behavior with this design to drive more sales. Download now!
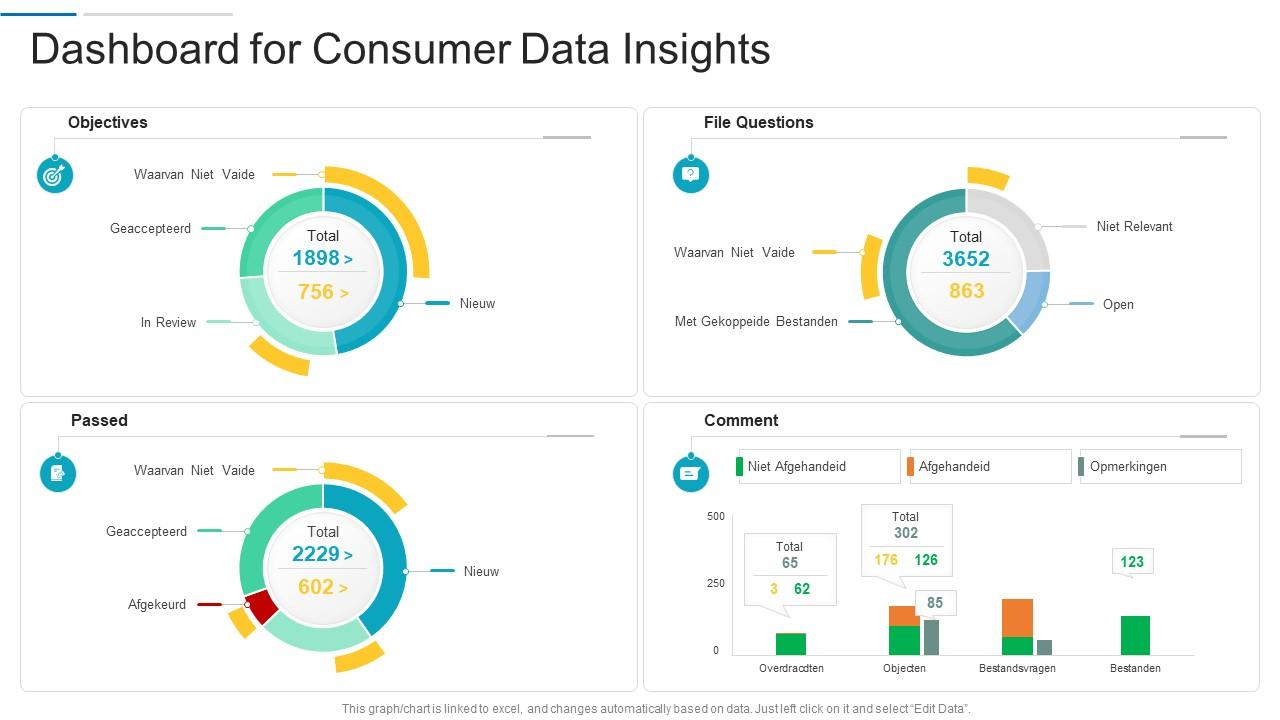
Template 7: Dashboard Snapshot For Consumer Data Insights
Customer insights help you prioritize business goals because they contain data that you can use to manage and improve customer satisfaction in the long run. With this PPT Template, you can conveniently showcase the objectives, file questions, and more, to improve customer satisfaction over time. Time to outperform your peers with this dashboard. Download now!
Template 8: Dashboard Depicting Website Data Insights Drafting Branding Strategies To Create Brand Awareness
Insights help you better understand your business and optimize it based on data analysis. This PPT Template depicts website data insights that cover channels such as display, social, and email with total sessions, pages, average session duration, bounce rate, etc. With our design, create brand awareness to boost website traffic. Get it now!

Template 9: Customer Satisfaction Survey Insights of IT Company Dashboard
High customer satisfaction leads to greater consumer retention, increased lifetime value, and a stronger brand reputation. Our PPT Design showcases the insights of a survey conducted by an IT company to know whether their customers are satisfied with their services or not. This design also includes questions related to their respective services and suggestions for improvement. Download now and attract more audience.

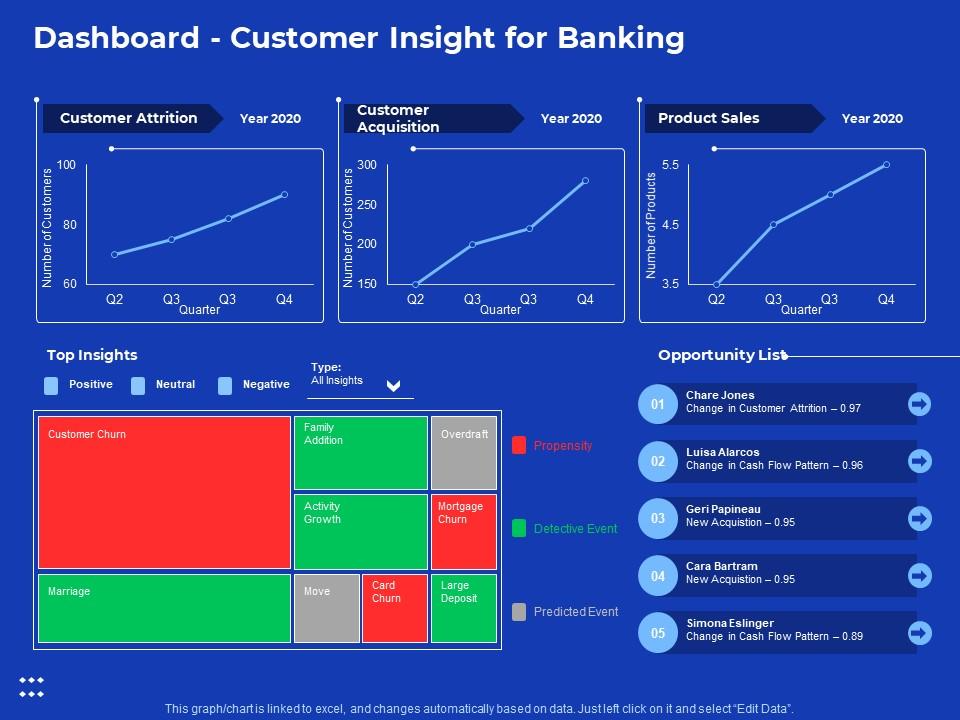
Template 10: Dashboard Customer Insight For Banking Process Improvement In Banking Sector
Banking processes help in reducing the number of redundant processes and increase operational efficiency. By deploying our PPT Template, you can enhance the process by taking the customer attrition rate, product sales, top insights, etc., into consideration. Download now!
Final Words
In today's highly intelligent and information-based corporate environment, data is a highly useful source of information. When developing business intelligence, it is critical to consider business insights. Instead of continuing with what has been, business insights provide a more nuanced view of what could be.
This collection of insights dashboard PPT Templates available from SlideTeam can reveal opportunities for growth while fostering a deeper understanding of a company's operations and markets. Now is the time to take charge because businesses that utilize these insights are more likely to succeed.
P.S.- Time for you to get hold of a well-designed product dashboard that gives data-driven, real-time insights. Explore some of the best in the business now!
FAQ’s on Insights Dashboard
What is the purpose of a dashboard?
A dashboard's primary purpose is to display a comprehensive overview of data from various sources. Dashboards are useful for monitoring, measuring, and analyzing important data. They take raw data from various sources and present it in a way that is tailored to the needs of the viewer—whether you're a business leader, line of business analyst, sales representative, marketer, or anything else.
What can a dashboard measure?
Dashboards are highly versatile aggregation and visualization tools used by professionals or subject matter experts to analyze complex data or to track and present data to non-subject matter experts. Dashboards can be used to track things like:
- Metrics for customers
- Financial details
- Information on sales
- Web analytics Manufacturing data
- Data on human resources
- Marketing performance Logistics data
Describe the importance of dashboards.
Dashboards are useful because they enable people to make better, more informed, data-driven decisions. They help you get a more precise, in-the-moment understanding of what's happening in the company and navigate rapid, sometimes difficult, changes because they're dynamic, interactive, and show near real-time data.
What are the advantages of using a dashboard?
The following are some of the benefits of using this tool. Among the most significant advantages are:
1- Customizable- Dashboards can be tailored to specific users and expectations.
2- All-inclusive- With this tool, you can see an overall situation report of the desired information at a glance.
3- Go into specifics- Dashboards are designed to provide as much information as needed by simply selecting the desired variable or object.
4- Data presentation is intuitive- Dashboards are designed to be simple to use for any user. The graphic design makes it simple and easy to navigate through the information.
5- Mobile device compatibility- Most dashboard software is designed to work with any mobile device. The goal is to get the most up-to-date information to anyone, anywhere, and at any time.