





 0 Comment
 Customer Reviews

Google does not recruit talent instinctively. Neither does Amazon nor Microsoft. All these giants have developed a strict system to screen candidates, where gut feeling takes a back seat and structured assessment leads the way. And this is where the Hiring Scorecard becomes relevant.
It is not just a checklist; it is the key to the judgment of a recruiter and the success of a company in the long term. The hiring scorecard is a guide and shield in an era where a single poor recruitment can bring down entire teams. It establishes the role, describes the competencies, and offers a platform where interviewers can compare notes without bias.
However, it is not that easy to construct such a scorecard. Which skills are more important: technical competence, cultural alignment, or leadership potential? What do you do to measure them across several interviews? The challenge for HR managers and business owners is not knowing why a Scorecard is critical, but how to design one that balances detail with usability.
Enter SlideTeam. Having years of experience in presentation design, we have developed a collection of professionally-selected hiring scorecard templates that eliminate guesswork. These templates provide organization, readability, and personalization, and assist you in capturing the spirit of great hiring in a format that stakeholders will immediately trust.
Several Fortune 500 companies already use such tools to simplify the recruitment process. You can join that elite set of customers with a download, now! Till you make up your mind, let’s take a tour of these impressive templates below.
Template 1: Recruiter Performance Scorecard for Talent Hiring PPT
This scorecard highlights key metrics to evaluate recruiter effectiveness in talent hiring. It monitors new employees, the quality rate of hiring, the satisfaction rate, and positive feedback regarding recruitment efficiency. This SlideTeam PPT allows results to be compared with the average benchmarks, and points out if there is an improvement in the performance. As an example, the increase in new hires, diversity recruitment, and satisfaction ratings is positive. The scorecard allows the company to see both the strong points and the aspects where improvement is possible, which is a useful tool in the improvement of recruitment strategies and the sustainable acquisition of talent.

Template 2: HR Recruitment Weekly Scorecard with Hired Candidates PPT Template
This scorecard gives a detailed account of the performance of recruitment on a weekly basis. It emphasises measures like the total number of applicants, shortlisting, hires, rejection, time to hire on average, and per-hire costs. The dashboard also displays the open positions by department, with the demand being shown in IT, Sales, Accounts, RM, HR, and Production. Recycled applications can be classified into such sources as referrals, social media, and job portals. A recruitment funnel graphically visualizes the process of getting applications to a hiring, providing a clear picture of the success, source effectiveness, and hiring of the applicants.
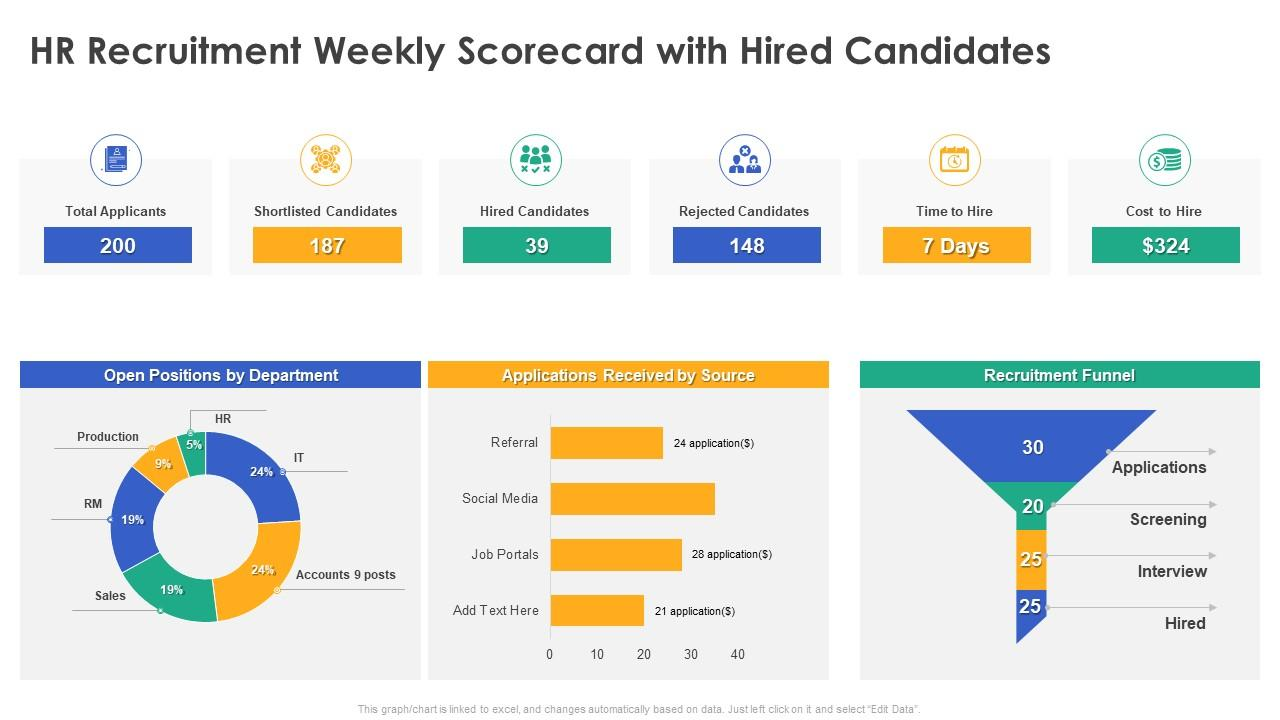
Template 3: Weekly Recruitment Conversion Rate Scorecard with Average Hiring Cost PPT
This PPT Set breaks down recruitment conversion rates, hiring costs, and efficiency ratings. It is a comparison of recruiter performance with conversion rates of 20, 18, and 12. The average hiring costs have been segregated according to the level of seniority, with the middle level being the most costly. The funnel used in the recruitment emphasizes the process of applications to the hires, which provides an insight into the efficiency of the process at every level. Moreover, the average time-to-fill per department is also compared with the targets, which is helpful to act in terms of increasing hiring velocity, cost-effectiveness, and the recruitment strategy.

Template 4: Recruitment Weekly Scorecard with Cost Per Hire PPT
This PPT Slide analyses recruitment expenses in a weekly format, distinguishing between the external and internal costs and the total cost per hire. As shown in the bar chart, cost changes were recorded in the seven weeks, where the highest costs ($500) were recorded in the external costs in Week 3. The internal costs are highest and are at the top at 250 dollars, while the total cost per hire is 100-150 dollars. Further, the report presents cost per hire by department, indicated as 541 Production, 321 Marketing, 1,051 Customer Care, and 689 other functions.

Template 5: Weekly Recruitment Scorecard with Quality of Hire PPT
This is a recruitment scorecard that brings out important measures of hiring quality and efficiency. There are differences in the time-to-fill chart according to the department, and the longest was Finance. The scores in recruiting efficiency are good in Johnathan and Jimmy, whereas in Jessica and John, the scores can be improved. The analysis of the source indicates that referrals and social media are the most successful channels for hiring. The quality of hire breakdown shows that there are 70 percent acceptable hires, 20 percent bad hires, and 10 percent quality hires, which can be used in action to work on the recruitment strategies and better the results.

Template 6: Scorecard To Shortlist and Hire Ideal Candidate
This is a scorecard, presenting a systematic way of screening candidates on the basis of their education, pertinent work experience, and communication skills. All the applicants will be rated on specific parameters, and the sums will establish their eligibility. Applicants who score better are more aligned with the qualifications desired, implying that they are prepared to pass through the second stage of hiring. This tool provides objective comparisons, minimizes bias, and efficient recruitment of the best talent through standardization of the evaluation. It simplifies the decision-making process and increases equity in the selection of candidates during recruitment.

Template 7: HR Recruitment Scorecard with Multiple KPI
To present a holistic picture of the effectiveness of hiring, various recruitment KPIs have been incorporated in this scorecard. It includes time to fill within the departments, quality of the hires in the categories such as strong, acceptable, and poor, and the efficiency of the recruiter. Other pieces of information are the reports of new hire turnover rates in several years and the analysis of source yields, with hires being compared to the number of candidates on the same platforms, such as referrals, social media, and job search engines. When combined, these measures indicate strengths, weaknesses, and weaknesses in current recruiting that require enhancement to strategic workforce planning.

Template 8: Weekly Recruitment Funnel Scorecard with Total Interviews
In this scorecard, the funnel of recruitment per week is emphasized, and it indicates how the applications are turned into hires. The funnel metrics follow 51 applications, 43 interviews, 21 assessments, and 11 hires. It provides the average duration of every step, where 1-2 days will be spent on reviewing, interviewing, evaluating, and making final hiring decisions. Recruiter-specific conversion rates are compared to the length of the recruitment cycle. With such insights, one can locate bottlenecks and make the best use of recruitment to achieve improved hiring results.

Template 9: Weekly Recruitment Trend Scorecard with Sources and Departments
This scorecard brings out the weekly recruitment performance trends by giving an insight into the hiring rates, additions of employees, and contributions made by the department. It shows a four-week trend analysis of hiring and breakdowns of the hires by supervisors and divisions. A visual chart is used to compare the effectiveness of recruitment sources, including advertisements, social media, referrals, and others. Department-wise information displays the hiring rates and employee levels and offers an insight into how the workforce is deployed. This general overview assists organizations in knowing the effective recruitment channels and streamlining hiring methods to ensure greater efficiency and resource alignment.

Template 10: Recruitment Dashboard for Managing Human Capital PPT
This PPT Dashboard provides a comprehensive insight into the human capital management devoted to the cost visibility, retention risks, as well as diversity. It brings out the total compensation distribution among employees and contingent workers, including aspects that affect retention like compa-ratio, promotion schedules, and tenure. The contingent workforce analysis divides the number of workers based on tenure. Moreover, the diversity indicators monitor the representation of millennials, females, and the disabled in the workforce relative to targets and thus achieve inclusiveness objectives.

Scoring Success in Hiring
In the end, recruitment is not a process of filling a position; it is a process of creating a future for your organization. A well-developed scorecard introduces objectivity, consistency, and fairness to the table, where all the candidates are evaluated against the standards that are most important. In its absence, even the most skilled HR departments will be left to chance.
The decision is obvious: do not leave recruitment as a game of chance. Arm your teams with instruments that introduce rigor to all decisions. Get these SlideTeam templates now and establish a new standard of excellence in hiring.
FAQs on Hiring Scorecard
Why is a hiring scorecard important in the recruitment process?
Hiring scorecards ensure that bias is reduced since they help in equalizing the evaluation of candidates according to specific requirements, resulting in fairer and more objective decisions in hiring. It encourages uniformity in the interviews, aids in harmonizing the interviewer with the job criteria, and makes decisions grounded in data by measuring the performance of the candidates. This systematic style enhances objectivity, equal treatment of the candidates, and eventually allows one to spot candidates who suit the job and the organization better.
What are the key components of an effective hiring scorecard?
A good hiring scorecard would consist of job-specific criteria based on behaviour, a definite rating scale, structured interview questions that would be used to evaluate the candidates in the same way, a section of notes and evidence, and an overall recommendation. Scorecards can minimize bias, make a consistent evaluation, and help make decisions based on data to hire more qualified people by giving them a tool with standardized and objective results.
How can job requirements and role expectations be translated into scorecard criteria?
In order to map job requirements and role expectations to scorecard criteria, it is first required to define the purpose of the scorecard before establishing the main skills, competencies, and responsibilities as given in the job description and matching them to specific, measurable Key Performance Indicators (KPIs) and behaviors. Weight criteria, create an explicit rating scale and expectations of each level, and use both qualitative and quantitative data to have a balanced and holistic analysis.