

 0 Comment
 Customer Reviews

The build's done. The game's in players' hands.
And now someone on the team asks: "So how's it going?" And there's a beat—just long enough to be uncomfortable—before anyone answers. Because "going well" isn't an answer. Downloads are up. Maybe. Session lengths are—unclear. Retention at Day 7 is... somewhere in a spreadsheet nobody's opened since launch.
Game development doesn't end at launch. That's the part nobody warns you about. The product ships, and immediately a different kind of work begins: figuring out if anyone's actually staying, spending, coming back. Whether the loop holds. Whether the economy makes sense. Whether the level that took three months to build is where everybody quits.
The metrics exist—Daily Active Users, churn rate, session length, player lifetime value, monetization conversion. They're not complicated concepts. But pulling them into a coherent picture, one you can actually present to a publisher or a studio head or an investor, that's where things get slow and expensive. You end up either building dashboards from scratch or presenting numbers without context, and neither works.
There's also the gap between tracking something and understanding it. A lot of teams watch their Monthly Active Users climb and assume health. Then they check the DAU-to-MAU ratio and realize most of those users showed up once. Player acquisition cost looks fine until you account for churn rate. In-game purchase analytics tell you what sold, but not why the other 94% of players never got there.
Game development KPI dashboards exist because this problem is universal. Every studio—indie or AAA—eventually needs to stand in front of someone and explain what the numbers mean. Not just list them. Explain them.
SlideTeam's pre-designed templates for game development metrics handle exactly this: the structure you need when the numbers are ready but the presentation isn't. Content-ready frameworks built for game analytics, player behavior, roadmaps, investor decks—so you're not starting from a blank slide at 11pm before a stakeholder review.
What follows are the templates that make the conversation easier.
Template 1: Leveraging Player Engagement Metrics for Game Development PPT Structure
Player engagement sits at the center of every game development decision worth making. This PPT template is built for developers and product managers who need to present engagement data clearly to stakeholders. It covers the metrics that matter — session frequency, user interaction depth, and behavior patterns — in a format that holds up in both internal reviews and investor conversations. Use this deck to anchor game development KPI discussions around real player engagement metrics. The template is 100% editable and customizable.
[product_image id=1438417]
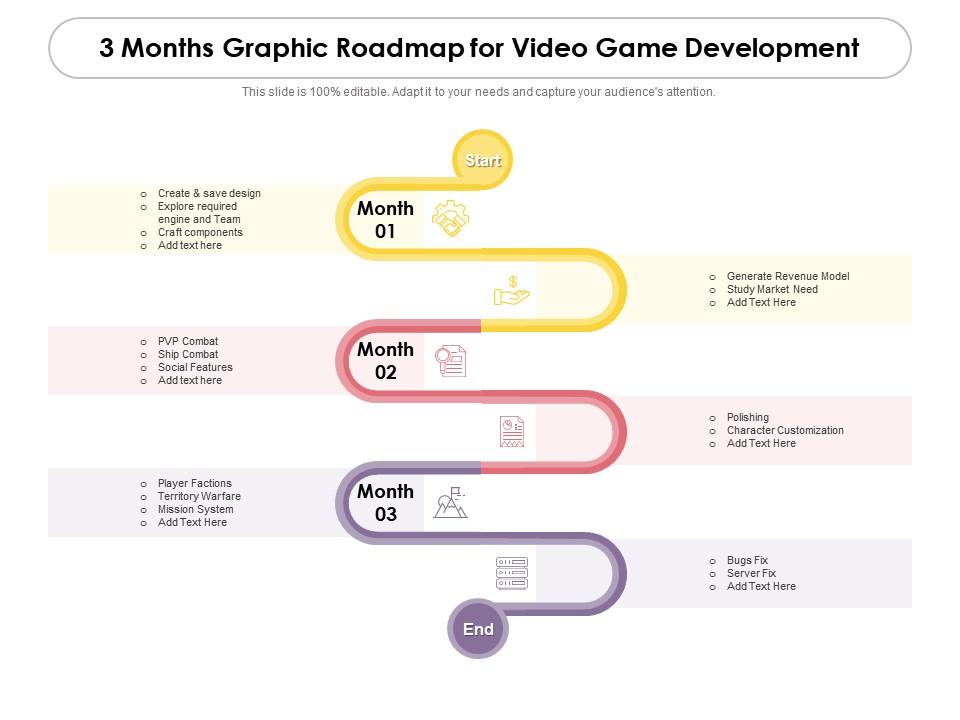
Template 2: 3 Months Graphic Roadmap for Video Game Development
Short-cycle planning is often where video game development gets real. This PPT template gives producers and project leads a clear three-month visual roadmap for tracking milestones across design, build, and testing phases. It works well when you need to show a publisher or internal team exactly where the game sits in the development timeline. For context, a tight 90-day view keeps mobile game performance metrics and sprint priorities visible at once. The template is 100% editable and customizable.
Download this PowerPoint Template
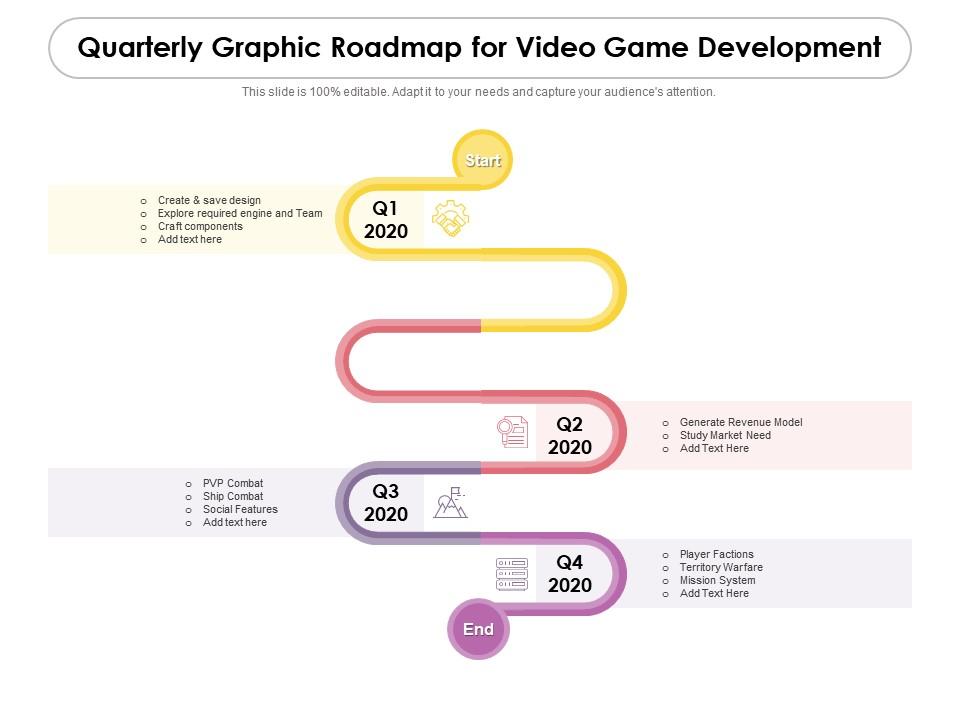
Template 3: Quarterly Graphic Roadmap for Video Game Development
Quarterly planning drives clarity when game development spans multiple release cycles. This template delivers a structured visual roadmap for tracking progress across four distinct phases, giving studios and publishers a shared reference point. Each segment captures sprint goals, milestone markers, and key deliverables in one clean view. Use this layout for game performance benchmarks and quarterly stakeholder reviews. Download this pre-designed framework now and keep your development timeline on track every quarter.
Download this PowerPoint Template
Template 4: 6 Months Graphic Roadmap for Video Game Development
A six-month horizon is where most mid-stage game projects live — past concept, not yet at launch. This PPT template gives developers and producers a graphic roadmap that covers the full stretch, from feature completion to QA cycles to pre-launch marketing windows. It's the right slide when a leadership team needs to see the whole arc, not just the next sprint. Use it to map player acquisition cost timelines and development ROI projections against real delivery dates. The template is 100% editable and customizable.

Download this PowerPoint Template
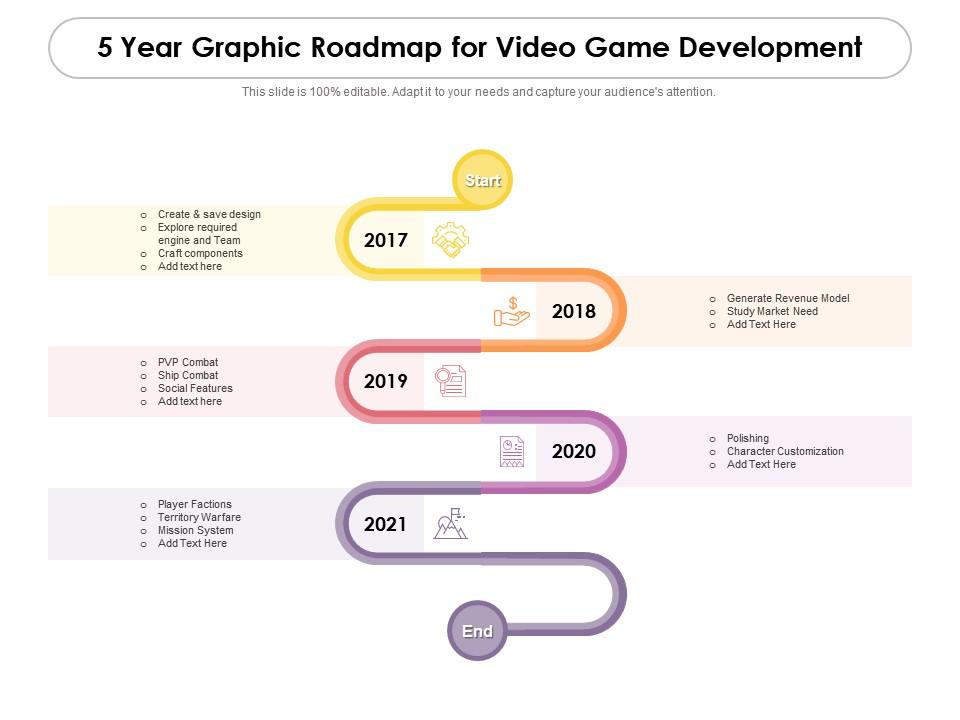
Template 5: 5 Year Graphic Roadmap for Video Game Development
Long-range planning separates studios that scale from studios that scramble. This template lays out a five-year visual roadmap for video game development, giving strategy leads and studio directors a clear structure to present franchise plans, platform expansions, and revenue milestones. Each year segment anchors key development goals to timelines investors and board members can follow. Deliver your Game Development ROI projections with confidence using this content-ready layout. Download this dynamic template now and map your studio's five-year vision with precision.
Download this PowerPoint Template
Template 6: Half Yearly Graphic Roadmap for Video Game Development
Half-year roadmaps work best when a team needs both detail and distance — close enough to act on, far enough to plan. This template structures a six-month view of video game development progress, making it easy to present mid-cycle milestones to publishers, co-development partners, or internal leadership. It anchors user engagement metrics and delivery targets in a single, readable visual. Transform your game project planning presentations today. Download this powerful template now and present your half-yearly roadmap with clarity and confidence.

Download this PowerPoint Template
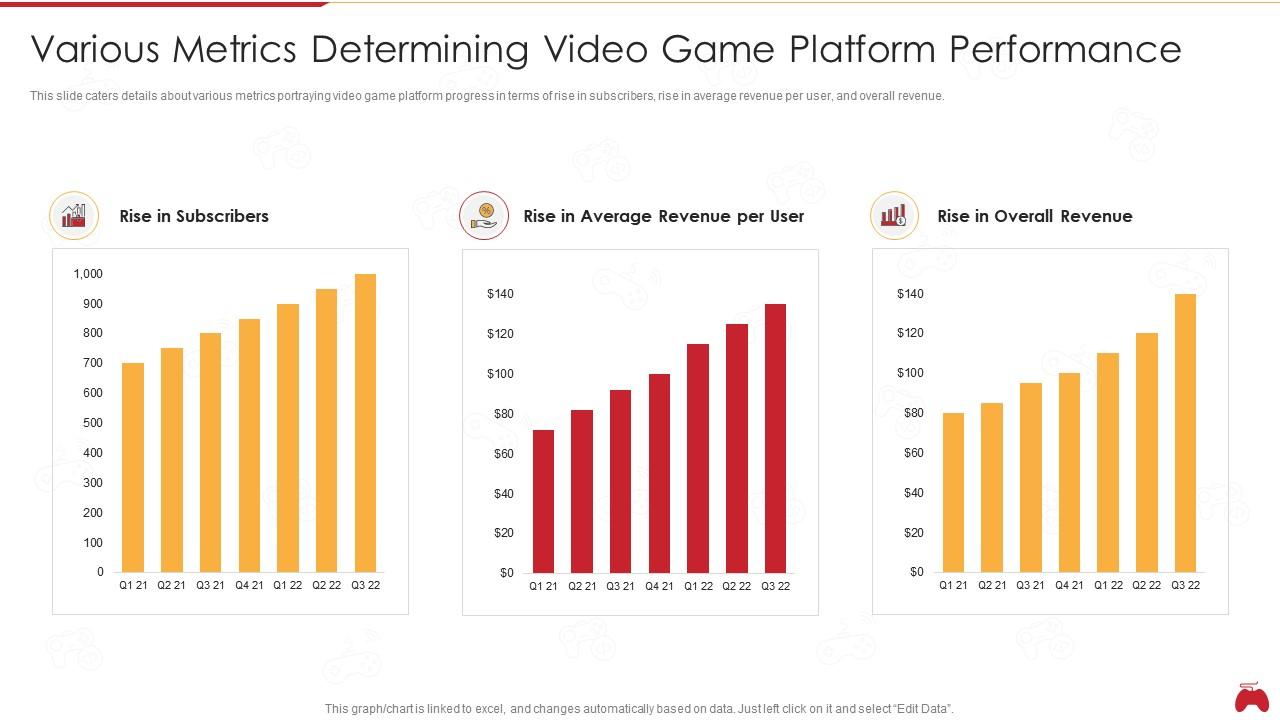
Template 7: Computerized Game Investor Funding Deck Various Metrics Determining Video Game Platform Performance
Investor decks for games live or die on how clearly the numbers tell a growth story. This PPT preset is built for game founders and business development leads presenting platform performance to funding audiences. It covers subscriber growth, average revenue per user, and overall revenue trends in a format that answers investor questions before they're asked. Btw, game monetization metrics rarely land well without a clean visual structure — this slide provides exactly that. The template is 100% editable and customizable.
Download this PowerPoint Template
Template 8: Online Adventure Game Elevator Various Metrics Determining Video Game Platform Performance
Elevator pitches for online games need to move fast and prove traction. This PPT template is built for studios and founders who need to show platform momentum — rising subscribers, growing average revenue per user, and total revenue — in a format that holds attention in under five minutes. It cuts straight to the game revenue metrics that funding audiences actually weigh. Use it when you need a tight, credible performance snapshot for a pitch or investor update meeting. The template is 100% editable and customizable.

Download this PowerPoint Template
Template 9: Metrics Evaluated for Blockchain Game Introduction to Blockchain Enabled Gaming
Blockchain gaming introduces a distinct set of performance questions that traditional game analytics tools don't fully address. This PPT slide is built for blockchain game developers and product leads who need to track retention, engagement, conversion rate, and Daily Active Users across decentralized game environments. For context, these four metrics are the clearest early signals of whether a blockchain game loop is holding player interest. Use this deck to ground in-game purchase analytics conversations in data that stakeholders can act on. The template is 100% editable and customizable.
[product_image id=1147966]
Template 10: Timeframe Allocation for Game Development Process Video Game Emerging Trends
Mapping a game development timeline across seven distinct phases removes ambiguity from studio planning. This template covers conceptualization, design, documentation, graphic asset creation, programming, QA testing, and soundtrack development in one structured visual. Studio leads and project managers reach for it when they need to show a complete production schedule to publishers or senior stakeholders. It anchors game testing metrics and QA milestones to real calendar windows, not vague estimates. Deploy these pre-built PowerPoint slides to present your full game development process with clarity and confidence.
[product_image id=1159857]
Win Every Stakeholder Review with SlideTeam
SlideTeam's PowerPoint templates are the best in the industry for presenting metrics for game development clearly and persuasively. These content-ready slides save hours of formatting work while delivering the professional structure that publishers, investors, and studio leads expect. From player retention metrics to game monetization dashboards, every framework is built for real decision-making conversations. Grab these ready-made templates to turn your game analytics into presentations that drive confident, informed action.
FAQs on Metrics for Game Development
What key performance indicators (KPIs) should game developers prioritize during the early access phase to predict long-term success?
During early access, focus on Day 1 and Day 7 retention, average session length, and crash rate. These three tell you whether the core loop works and whether the build is stable enough to hold players. Churn rate in the first week is also worth watching closely. Together, these KPIs give the clearest early signal of long-term viability before the full launch window closes.
How does Day 1, Day 7, and Day 30 retention rate data influence decisions about game loop design?
Day 1 retention shows whether the first impression works. Day 7 tells you if the core loop is compelling enough to pull players back. Day 30 reveals whether progression and rewards are sustaining interest. Low numbers at any stage point to a specific break in the game loop — onboarding, mid-game pacing, or reward frequency. Developers use this data to decide where redesign effort goes first.
What is the relationship between session length metrics and monetization potential in free-to-play mobile games?
Longer sessions correlate with higher spending in free-to-play games — players who stay in the game longer encounter more purchase prompts and develop stronger investment in progression. Session length analytics also reveal when players are most engaged and most likely to convert. Short sessions, by contrast, often indicate weak loops that never reach the moment where spending feels worthwhile.
How can churn rate analysis help identify critical drop-off points in a game's narrative or progression system?
Map churn rate against specific in-game events or progression milestones. A spike in churn at a particular chapter or difficulty stage points to a design problem, not a player problem. This data tells you where to look — a frustrating difficulty curve, a narrative gap, or a paywall — rather than guessing. Fix the drop-off point, then track whether churn recovers in the next release cycle.
What distinguishes vanity metrics from actionable metrics in the context of live service games?
Vanity metrics look good in a report but don't change decisions — total downloads and social followers are common examples. Actionable metrics tell you something you can act on: Day 7 retention, conversion rate on a specific offer, or average revenue per daily active user. In live service games, the test is simple: if a metric doesn't tell you what to change or where to invest next, it's vanity.
How should developers balance DAU (Daily Active Users) versus MAU (Monthly Active Users) ratios when evaluating community health?
A healthy DAU-to-MAU ratio sits between 20% and 40% for most live service games. Below that, many monthly users are visiting once and leaving — a retention problem, not a growth one. Tracking this ratio weekly surfaces community health issues early. When DAU drops relative to MAU, look at whether recent updates changed daily incentives or broke a habit-forming loop players depended on.
What role does ARPDAU play in comparing the revenue efficiency of different in-game economy models?
ARPDAU — average revenue per daily active user — measures how efficiently a game's economy converts engagement into income on a per-day basis. It lets you compare two games directly, regardless of total player count. A game with fewer Daily Active Users but higher ARPDAU may have a healthier in-game economy than a larger one with weak monetization. Use it to evaluate whether economy changes are actually improving revenue efficiency.
How can heatmap data from player movement be used to improve level design and reduce frustration points?
Heatmaps show where players cluster, where they avoid, and where they die repeatedly. High-death zones in the same spot indicate a design or difficulty problem, not a player skill problem. Areas players avoid entirely may signal poor visual signposting. Level designers use this data to adjust enemy placement, path clarity, and reward positioning — concrete changes that reduce frustration and improve completion rates measurably.