





 0 Comment
 Customer Reviews

You launched your product. Great!
The big question is: how are users interacting with it? Are they exploring the key features, or just logging in and logging out?
If you don't have answers to these questions and are clueless about the actual picture of user engagement, every decision you make is like flying blind.
Today, depending on assumptions is a recipe for churn. You require real-time insights into feature adoption, usage frequency, and user behavior. That’s where a Product Usage Dashboard becomes handy.
With the right dashboard, you can keep a track of session duration, identify drop-off points, and analyze feature utilization across multiple user segments. You no longer need to stress about why users are leaving Since you’ll know exactly where and when. These insights help teams double down on what works and fix what doesn’t. These pre-designed, content-rich templates turn usage data into clear, actionable visuals.
Your users may not fill out feedback forms, but their clicks, taps, and scrolls are talking. A Product Usage Dashboard helps you in listening without interrupting.
Here's how it helps you:
- With the help of a dashboard, you can understand real engagement, session duration, and usage frequency to see what truly adds value.
- You can spot drop-offs and bottlenecks through churn analysis which identifies where users get stuck or lose interest.
- With the help of feature utilization and adoption trends you can determine which parts of your product users love and which need work.
Explore these ready-to-use slides now!
Template 1: Dashboard Depicting Product Usage Metrics
This PPT Template highlights a complete dashboard that visualizes product use information. The eye catching comes with colorful charts, graphs, and globe maps that turn complex data into easily digestible information. It enables presenters to offer appealing data-driven presentations. The slide includes details about user statistics, event patterns, and product loyalty indicators. It is ideal for product managers, analysts, marketing teams, and executives that need to show consumption data at board meetings or stakeholder presentations. Download now!

Template 2: Product Usage User Engagement Dashboard Showing Active Accounts
This PowerPoint Template has a complete user engagement dashboard that monitors active accounts across many different variables. The visually appealing style uses colorful charts, graphs, and key performance indicators to show challenging use information in an understandable way. This template converts basic facts into appealing visual narratives by covering topics such as monthly active users, stickiness rates, distribution analytics, and wage competitiveness. Grab it today!

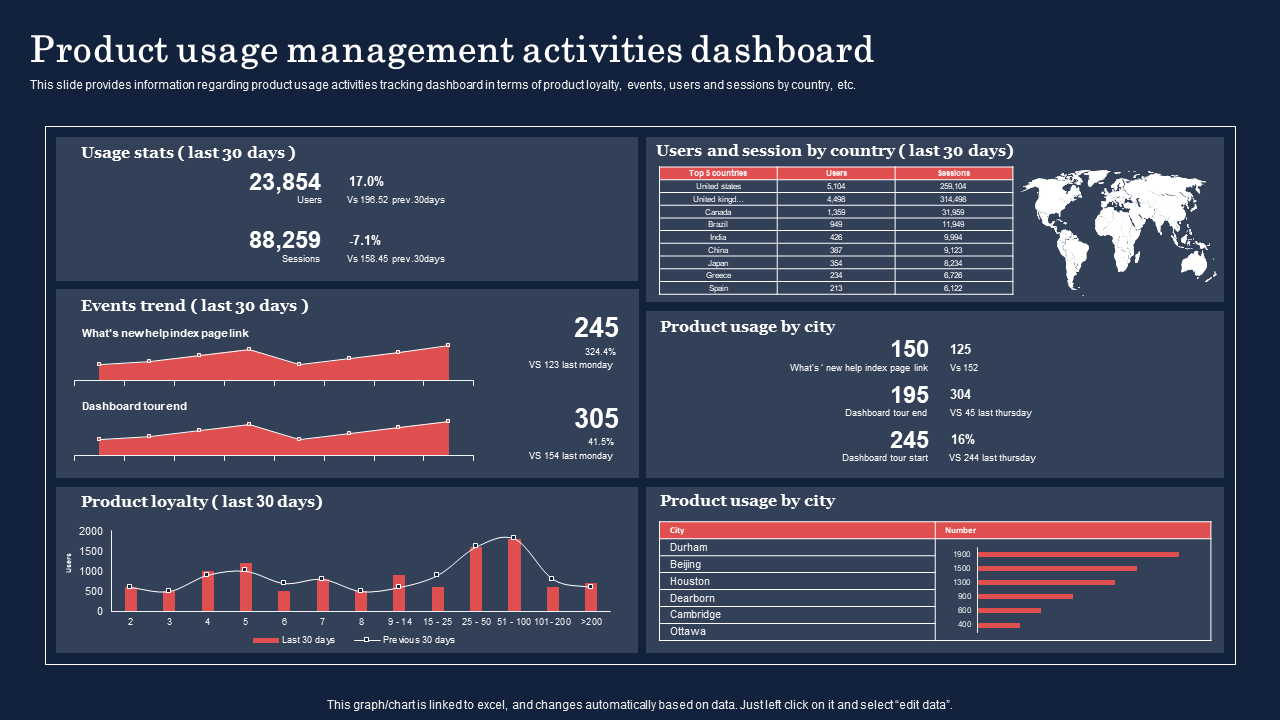
Template 3: Product Usage Management Activities Dashboard
Ever wondered how to quickly demonstrate where, how, and how much your product is being used? This product usage management activities dashboard PPT Template makes it easy to track statistics, trends, and usage by nation or city. The layout is simple to follow, with graphs and charts that highlight your data. It's ideal for product managers and marketing teams that want to present accurate information while keeping their audience engaged from the first slide to the last. Download now!
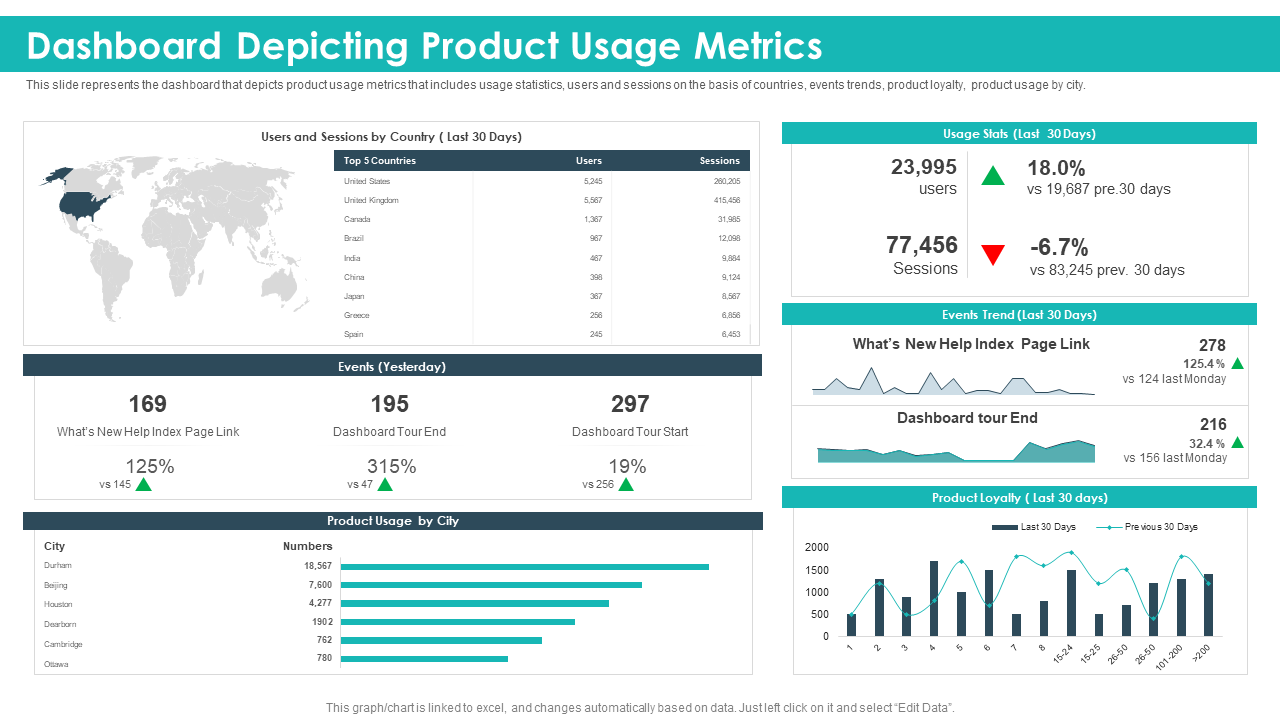
Template 4: Dashboard Depicting Product Usage Metrics
Do you want to use product data to communicate a story rather than just numbers? This PowerPoint Template on dashboards demonstrating product utilization numbers accomplishes just that. It displays user statistics, session trends, event activities, and city-level usage in a neat and well-organized format. Built-in charts and comparisons make it simple to identify trends and progress. The combination of images and data highlights your ideas and keeps your audience engaged. Grab it today!
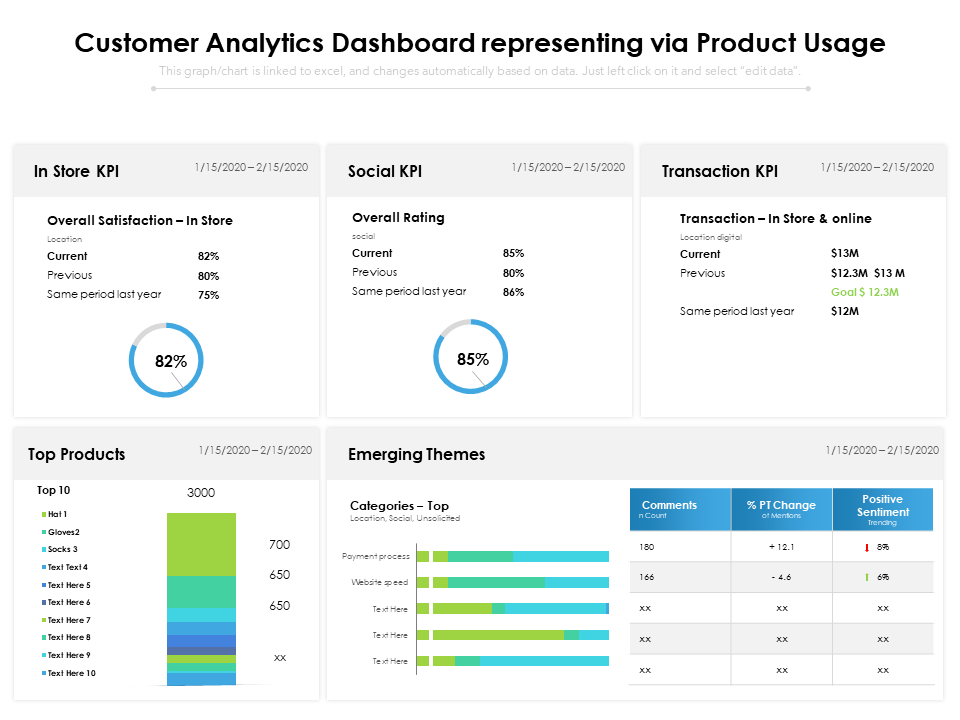
Template 5: Customer Analytics Dashboard Representing Via Product Usage
Understanding client behaviour through data is crucial for company success! This PPT template simplifies complex analysis of products and delivers clear, actionable information. The well-organized style includes visually appealing charts, KPI circles, and colourful graphs showcasing satisfaction ratings, transaction volumes, and top-performing goods. With sections on in-store performance, social indicators, and new trends, this template makes data visualization simple and effective. Download now!
Template 6: Statistical Data Showcases Technological Usage for Employee Marketing
How does technology affect employee marketing strategies? This PowerPoint Template delivers statistical understanding in the form of eye-catching circular charts and well-organized data sections, making complicated material easier for readers to comprehend. The professional layout blends colourful visualisations with clear percentages to highlight AI applications, results from surveys, and major interaction patterns. With specific sections for insights and practical implementations, this template assists presenters in telling informative stories about technological adoption in workplace marketing. Grab now!

Template 7: SaaS KPI Dashboard Highlighting Product Usage
Tracking user behaviours should not be like solving a puzzle. The SaaS KPI dashboard highlighting product usage template transforms complicated data into understandable illustrations. It includes user logins, document uploads, NPS scores, and more. The layout is basic but effective, allowing you to tell a story using charts, trends, and section breakdowns. It's designed for reducing time while increasing effect, whether you're presenting to stakeholders or coordinating teams. Download today!

Template 8: Impact Analysis by Technology Usage Dashboard
The given slide outlines a complete technology impact study using four unique dashboard panels. It indicates allocation percentages across categories and applications. The simple framework uses bar charts and well-organized data divisions to convert complicated use numbers into clear visual information. The purpose of designing this template is to simplify data visualisation while highlighting technology adoption trends. Employ this template to showcase engagement and growth in a way that’s easy to follow and hard to forget. Grab it today!

Template 9: Website Usage Agile Analytics Dashboard
Knowing when and how customers interact with your website can yield major benefits. This website's agile analytics dashboard template collects all of the data user counts, sales, traffic surges, etc. to present it using visuals and graphs. It enables fast understanding of trends like busy hours and plan performance without having to go through unprocessed information. By employing this template, you can quickly emphasize crucial topics, making your presentations more compelling. Download today!

Template 10: Dashboard for Innovative Product Performance in Market
This well-organized PPT Template presents a professional framework which includes circular charts, price arrows, product lists, etc. making data visualization simple and effective. It supports presenters in telling engaging market analysis tales. The professional design maintains audience focus while conveying crucial performance indicators that influence strategic choices. Grab it now!

Know What Works, Improve What Doesn’t
If you want to build a product users love and actually use, you need to track how they interact with it. To streamline this process pick the most relevant templates from the above mentioned set. These templates include intuitive visuals, real-time analytics, and a focus on what actually matters. Download today and let the data shape your next big product win.
PS: Also explore our user dashboard templates with samples and examples!
FAQs on Product Usage Dashboard
1. What are the key metrics to track in a product usage dashboard?
A product usage dashboard presents how people use your product. Main things that you can track through a dashboard include how many users you have, how often the product is being used by them, and how long your audience stays on it. You can also keep tabs on which features they use the most, and if they stop using it after some time. Other metrics include tracking new users and user actions which can help in seeing what works well and what needs fixing.
2 .How can a product usage dashboard help improve product development?
A product usage dashboard can help in improving product development by presenting how people actually use a product. It provides clear data in terms of which features are used most and where they face problems. This helps in understanding the things that are working and what needs fixing. With the help of this insight, developers can make better decisions, add better features, and improve the ones that don’t work well. Moreover, It saves time and effort by focusing only on what matters.
3. What tools are commonly used to create an effective product usage dashboard?
In order to create an effective product usage dashboard, you can employ common tools like Microsoft Excel, Google Sheets, Tableau, Google Data Studio, and more. These tools help in showcasing data in easy charts and graphs. This allows you to track how many people use a product, how often they use it, and what features they like most. These dashboards prove to be a great asset for making smart decisions quickly since they show clear data about how people are using a certain product.


