


 0 Comment
 Customer Reviews

Just imagine processes are so streamlined that defect rates are as low as possible, which helps you to achieve your near-perfect quality and efficiency required for business. This is achievable with the use of Six Sigma metrics.
Since its origin in the 1980s, Six Sigma has worked to transform industries by promoting data-driven continuous improvement initiatives, which strategically work to escalate their operational efficiency. It is a methodology employed as a common measurement tool to track the quality process. Six sigma metric is often used by manufacturing industries and businesses in conjunction with their manufacturing process to improve the quality of business efficiency as well as product quality.
Improve your process through measurement and streamline your operations while eliminating errors. Check out our Top 10 Six Sigma Quality Improvement Plan Templates now!
To simplify this task, we at SlideTeam have designed Six Sigma Metrics Template slides that will help you to gather data and deliver it in a professional manner. These PPT slides have been designed to allow leaders and businesses to make smarter, better, and transformative decisions that drive quality and profitability in the long run.
They are 100% editable and can be modified as per your requirements, being ready–to–use templates that communicate performance clearly and promote continuous growth.
Present complex data clearly with visually compelling template slides, and refine your project scope with the help of these our Top Six Sigma Proposal Templates. Download now!
Template 1 – Measuring Success with Lean Six Sigma Metrics PPT
Strategize your business efficiency with the help of our newly designed PPT slide on measuring the success of organizations with the assistance of Six Sigma metrics incorporated to improve the quality. This PPT has been crafted for professionals to empower teams and effectively track, analyze, and communicate the critical performance metrics to drive continuous improvement. It consists of detailed charts and dashboards to showcase performance metrics, and allows you to present structured layouts that measure, monitor, and optimize lean sigma initiatives.
[product_image id=1493802]
Template 2 – Importance of Measuring Success PPT Template
Get your hands on this template slide, which helps you to understand the importance of measuring success. Use it to enhance your organization’s quality management framework with the assistance. It helps emphasize the critical aspects required to study for the measurement of metrics that drive sustainable growth in the business. With a keen focus on rigorous data analysis, continuous improvement strategies, and a structured approach, you can understand and disseminate knowledge on the importance of measuring success.

Template 3 – Key Performance Indicators (KPIs)
Looking for a real-time tracking of your critical metrics for understanding growth and quality control in your organization? This template slide with the Six Sigma tool is perfect for you. It is ideal for quality managers, business analysts, or Six Sigma black belts, etc., who are working to drive measurable improvement to enhance the process and progress of the system while maintaining rigorous quality standards. This professionally designed PPT slide helps to present actionable data precisely, while measuring cycle time, costs, customer satisfaction levels, completion progress, etc.

Template 4 – Metric Selection Criteria PPT
Discover the power of this template to provide an epic metric selection criteria that seeks to provide an essential framework for choosing effective metrics within the Lean Six Sigma projects. It helps to draft measurable, relevant, and actionable metrics that align with the business goals to drive process improvement. Download this PPT slide to highlight key factors like data availability, business objectives, impact considerations, and other metrics which will help you to quantify the success of your project with continuous improvements.

Template 5 – Establishing Baselines and Targets
Are you looking for a presentation slide where you can strategically display your structured approach to establishing baselines and targets, essentials for successful lean sigma projects? Get your hands on this expertly designed PPT slide to define, analyze, set targets, monitor, collect, implement, and refine your data and project deliverables. It acts as a tool for quality management and process improvement initiatives, by facilitating accurate data analysis to quantify gaps and drive continuous performance.

Template 6 – Data Collection Techniques PPT
Accurate and systematic data is the backbone of every quality management system, as it assists in the process of improving project performance and helps to incorporate effects by ensuring that the data being used is reliable and valid for performance metrics. It helps you understand and perform various data collection techniques, which are required to facilitate effective decision making. This PPT helps to maintain data by minimizing bias, enhancing the accuracy of performance metrics, and incorporating techniques that support continuous improvement.

Template 7 – Data Analysis Methods and Tools PPT
Get your hands on this extensive template slide, which assists you in delivering an in–depth analysis of essential data required for quality management. By utilizing this slide, users can analyze data effectively, identify variation patterns, and monitor key quality indicators, while focusing on defect reduction and process optimization to facilitate informed decision-making in the end for continuous improvement. So optimize your process by reducing defects and enhancing your overall product and service quality with effective data analysis methods and tools.

Template 8 – Identifying Waste through Metrics PPT
Enhance efficiency and reduce operational costs by identifying waste through these metrics. Use this PPT slide to practice quality control and use statistical process control techniques to deliver solutions for the problems faced. Pinpoint inefficiencies that lead to defects, excess inventory, and non–value–added activities. Measure waste impact quantitatively and enable precise identification and prioritization of improvement areas.

Template 9 – Process Improvement Metrics PPT
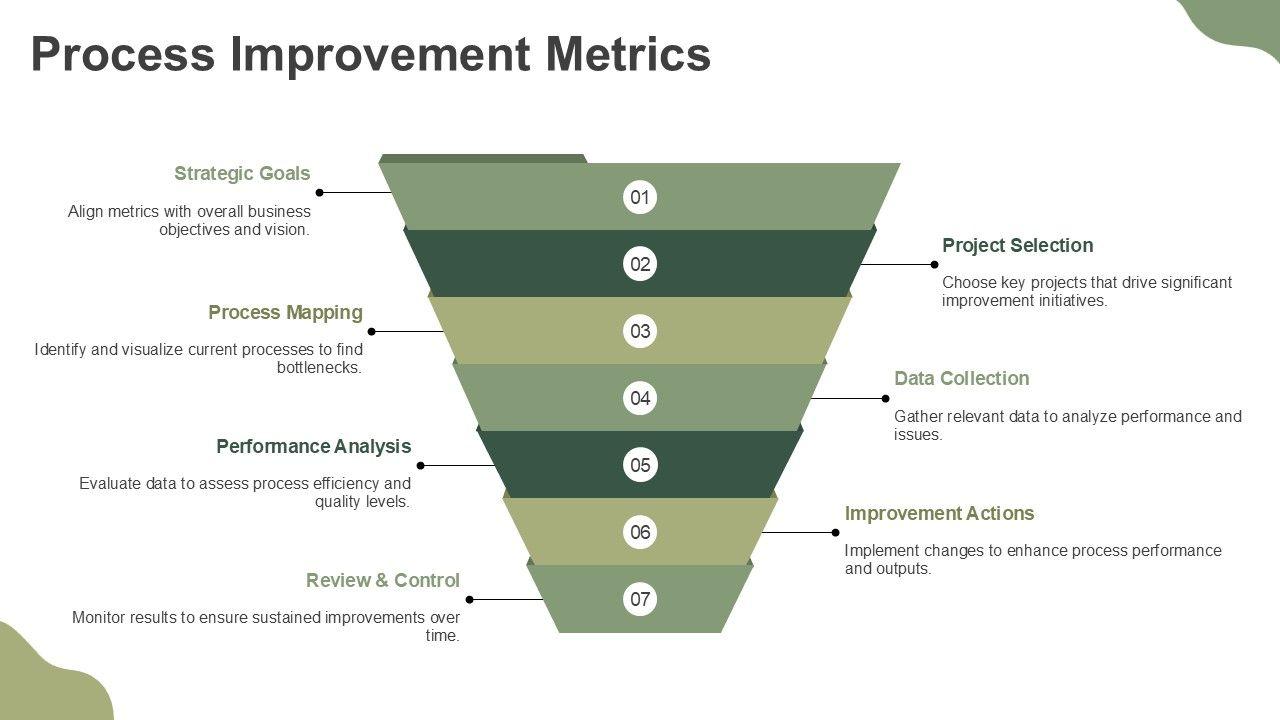
Check out this process improvement metric template slide, which has been engineered to elevate your continuous improvement process, which helps you to churn complex data into simpler, understandable form. It helps to highlight strategic goals, allows process mapping and performance analysis, and helps in review and control to monitor results to ensure sustained improvement has been carried out over time. Businesses can download this PPT slide to measure, analyze, and enhance their critical performance indicators to enable the flow of continuous improvement and foster sustained business success.
Template 10 – Customer Satisfaction Metrics PPT Template
Analyze and measure your customers’ satisfaction level from time to time and boost your business success rate. Make use of this template slide, which assists in continuity improvement and process optimization by helping businesses to track key performance indicators that showcase customers’ perceptions, experience, and satisfaction levels. This template is the perfect fit to analyze, identify, and address underlying issues impacting customer satisfaction.

Key Takeaways
Six Sigma metrics are the backbone of business when it comes to modern quality management, monitoring data, analyzing, and measuring it continuously for improving deliverables and efficiency. Download our customizable PPT template slides, which help you to track down KPIs, analyze data, and enhance customer satisfaction rate. With professionally designed PPT slides, you just don’t present data, you deliver actionable decisions and insights for sustainable growth.
Offer real-time data for your quality and performance metrics with the assistance of these customizable PPT slides that talk about some of the must-have Six Sigma dashboards. Click here to learn more!
FAQs on Six Sigma Metrics
What are the six key sigma metrics used in process improvement?
The common six sigma metrics, which have been used in process improvement, are:
- Defect Rate: used to measure the number of defects in a process per one million opportunities, to indicate the process error rate and efficiency.
- Sigma Level: Helps represent the capability of a process that produces defect-free output.
- First Time yield: It is the percentage of products or items that pass through a process which steps without any corrections
- Rolled Throughput Yield: an overall yield of a process that considers all the steps, including the process that accounts for defects and rework cumulatively.
- Defects per unit: It is an average number of defects which has been found in each unit produced.
- Cycle Time: the total time taken to complete a process from start to finish.
How is Defects Per Million Opportunities (DPMO) calculated in Six Sigma?
The Defect Per Million Opportunities is calculated with the total number of defects in the sample divided by the sample size units multiplied by the number of defect opportunities per unit, and overall, with 1,000,000.
What is the difference between DPMO and Sigmal Levels?
DPMO measures the levels of defects that you would expect in 1,000,000 opportunities for error. DPMP helps to measure quality across the process.
Sigma level is a statistical measure of a process that can tell how close a process is defect-free.