

Building Business Analytics Architecture Powerpoint Presentation Slides




Try Before you Buy Download Free Sample Product
 Impress Your
 Audience
 100%
100% Editable
 Save Hours
 of Time


The business transformation will allow the firm to enhance customer experience and optimize data center management, security standards, and improved operational capabilities. Here is a competently designed Building Business Analytics Architecture that covers details regarding the current potential implications faced by the firm in terms of high IT infrastructure cost, increased security threats, and data breaches. The template covers information regarding the categories such as system, network, and storage management, components such as computer hardware and software applications, and the data management platform involved in IT infrastructure management. It covers details about firms moving towards implementing intelligence infrastructure by determining dimensions for digitally advanced infrastructure, etc. The template covers details regarding workplace optimization such as intelligent automation at the workplace, enhancing operational capabilities by digitally transforming overall operational efficiency, etc. It also improves security standards by developing security centers, handling threats, incident management, data center management, optimizing network systems with network management architecture, etc. It will cover the budget assessment of technology advancement to functional areas, impact assessment for successful infrastructure intelligence implementation, and dashboard analysis for intelligence activities and cyber security management. Get access now.
People who downloaded this PowerPoint presentation also viewed the following :
Content of this Powerpoint Presentation
Slide 1: This slide introduces Building Business Analytics Architecture. State Your Company Name and begin.
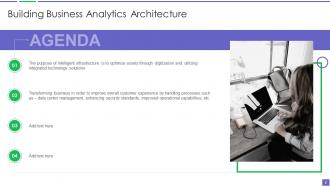
Slide 2: This slide states Agenda of the presentation.
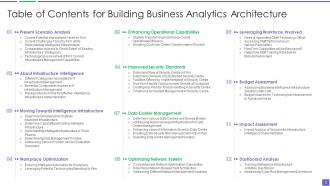
Slide 3: This slide presents Table of Content for the presentation.
Slide 4: This slide shows title for topics that are to be covered next in the template.
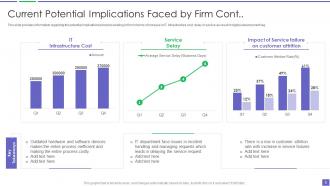
Slide 5: This slide provides information regarding the potential implications/concerns existing in firm.
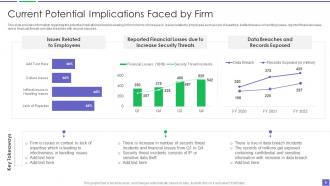
Slide 6: This slide displays potential implications/concerns existing in firm.
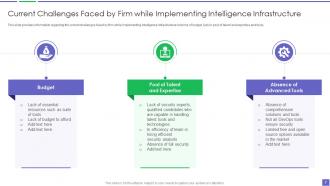
Slide 7: This slide represents Current Challenges Faced by Firm while Implementing Intelligence Infrastructure.
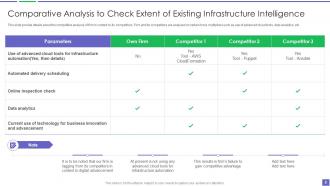
Slide 8: This slide showcases Comparative Analysis to Check Extent of Existing Infrastructure Intelligence.
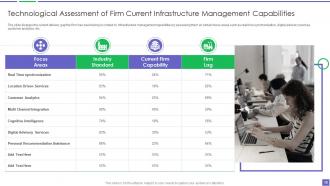
Slide 9: This slide shows Technological Assessment of Firm Current Infrastructure Management Capabilities.
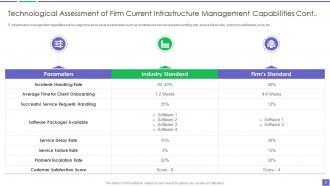
Slide 10: This is another slide continuing Technological Assessment of Firm Current Infrastructure Management Capabilities.
Slide 11: This slide shows title for topics that are to be covered next in the template.
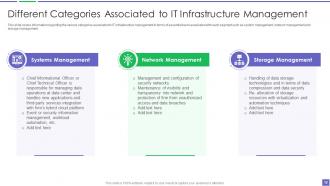
Slide 12: This slide presents Different Categories Associated to IT Infrastructure Management.
Slide 13: This slide displays Essential Components Involved in IT Infrastructure Management.
Slide 14: This slide represents Prerequisites for Firms for Effective Intelligence Infrastructure Implementation.
Slide 15: This slide shows title for topics that are to be covered next in the template.
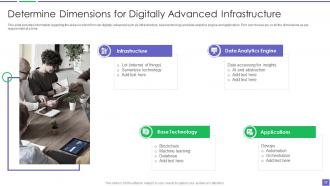
Slide 16: This slide showcases Determine Dimensions for Digitally Advanced Infrastructure.
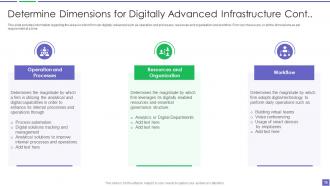
Slide 17: This is another slide continuing Determine Dimensions for Digitally Advanced Infrastructure.
Slide 18: This slide presents Determine Capabilities Enabling Intelligent Infrastructure.`
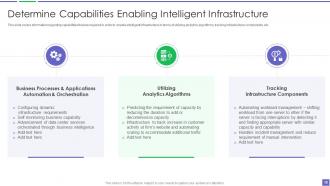
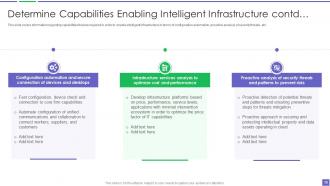
Slide 19: This slide covers information regarding capabilities that are required in order to enable intelligent infrastructure.
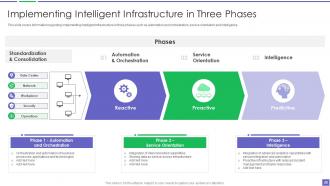
Slide 20: This slide represents Implementing Intelligent Infrastructure in Three Phases.
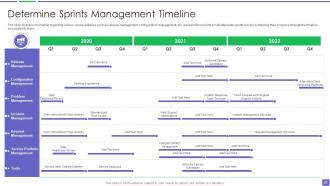
Slide 21: The slide displays information regarding various crucial activities such as release management, configuration management, etc.
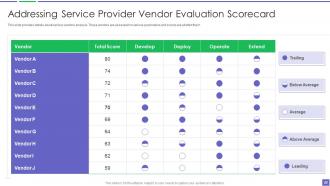
Slide 22: This slide showcases Addressing Service Provider Vendor Evaluation Scorecard.
Slide 23: This slide shows title for topics that are to be covered next in the template.
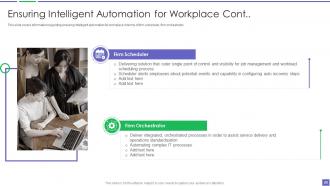
Slide 24: This slide covers information regarding ensuring intelligent automation for workplace.
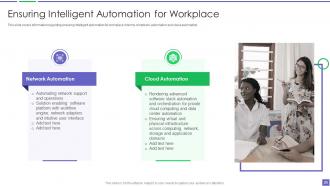
Slide 25: This slide displays Ensuring Intelligent Automation for Workplace.
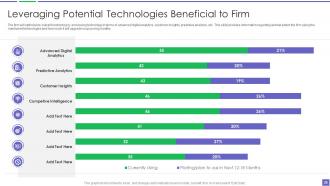
Slide 26: This slide represents Leveraging Potential Technologies Beneficial to Firm.
Slide 27: This slide shows title for topics that are to be covered next in the template.
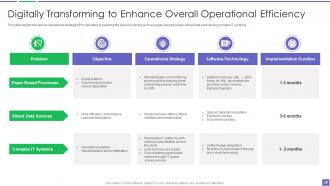
Slide 28: This slide showcases Digitally Transforming to Enhance Overall Operational Efficiency.
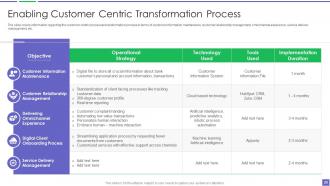
Slide 29: The slide covers information regarding the customer centric processes transformation.
Slide 30: This slide shows title for topics that are to be covered next in the template.
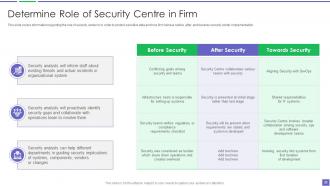
Slide 31: This slide covers information regarding the role of security center in in order to protect sensitive data.
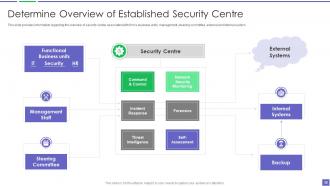
Slide 32: This slide provides information regarding the overview of security center associated with firm’s business units.
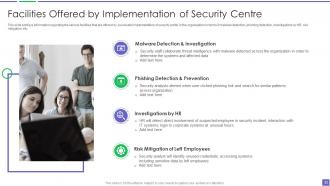
Slide 33: This slide showcases Facilities Offered by Implementation of Security Centre.
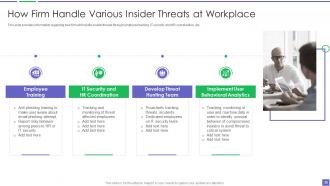
Slide 34: This slide presents How Firm Handle Various Insider Threats at Workplace.
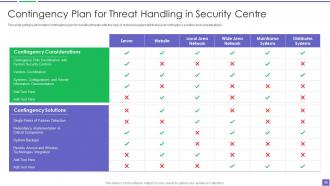
Slide 35: This slide displays Contingency Plan for Threat Handling in Security Centre.
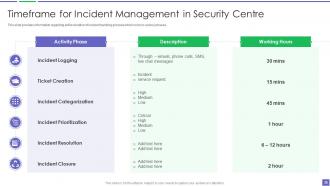
Slide 36: This slide represents Timeframe for Incident Management in Security Centre.
Slide 37: This slide shows title for topics that are to be covered next in the template.
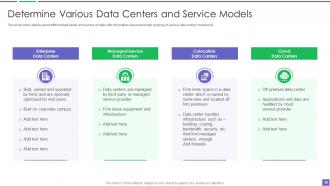
Slide 38: This slide covers details about different data center and service models with information about ownership.
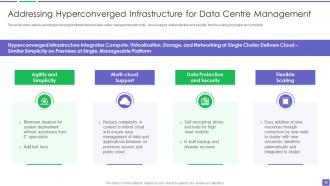
Slide 39: This slide represents Addressing Hyperconverged Infrastructure for Data Centre Management.
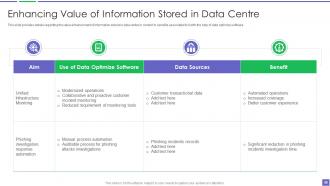
Slide 40: This slide showcases Enhancing Value of Information Stored in Data Centre.
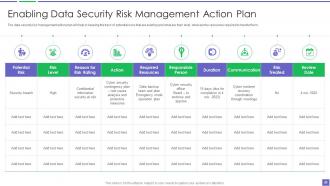
Slide 41: This slide shows Enabling Data Security Risk Management Action Plan.
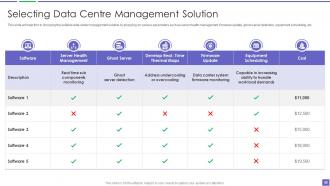
Slide 42: This slide will help firm in choosing the suitable data center management solution.
Slide 43: This slide shows title for topics that are to be covered next in the template.
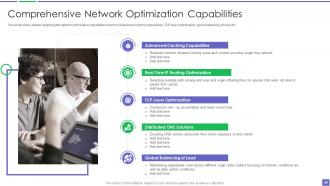
Slide 44: This slide covers details regarding the network optimization capabilities.
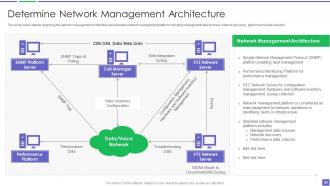
Slide 45: This slide displays network management architecture and standard network management platform.
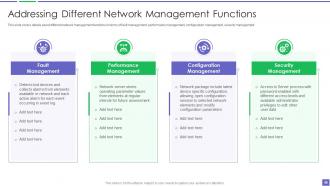
Slide 46: This slide covers details about different network management functions in terms of fault management.
Slide 47: This slide shows title for topics that are to be covered next in the template.
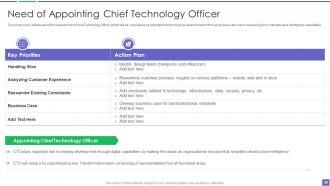
Slide 48: This slide covers details about the requirement of Chief Technology Officer.
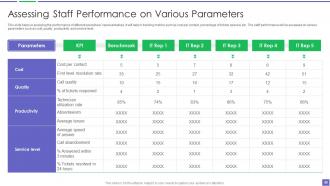
Slide 49: This slide presents Assessing Staff Performance on Various Parameters.
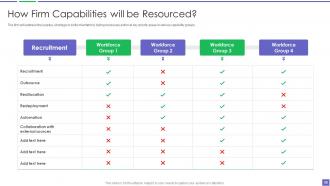
Slide 50: This slide displays How Firm Capabilities will be Resourced.
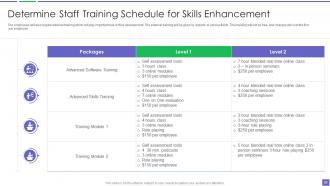
Slide 51: This slide represents Determine Staff Training Schedule for Skills Enhancement.
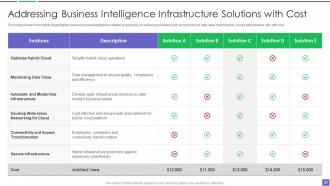
Slide 52: This slide showcases Addressing Business Intelligence Infrastructure Solutions with Cost.
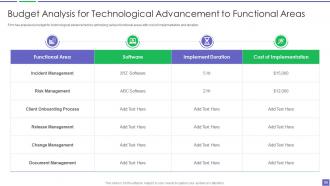
Slide 54: This slide presents Budget Analysis for Technological Advancement to Functional Areas.
Slide 55: This slide shows title for topics that are to be covered next in the template.
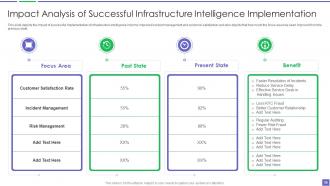
Slide 56: This slide displays Impact Analysis of Successful Infrastructure Intelligence Implementation.
Slide 57: This slide shows title for topics that are to be covered next in the template.
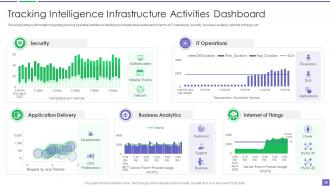
Slide 58: This slide portrays information regarding tracking essential activities in intelligence infrastructure dashboard.
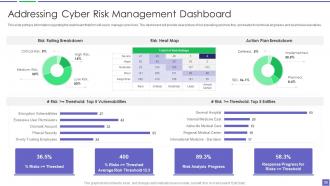
Slide 59: This slide presents dashboard that firm will use to manage cyber risks.
Slide 60: This slide displays Icons for Building Business Analytics Architecture.
Slide 61: This slide is titled as Additional Slides for moving forward.
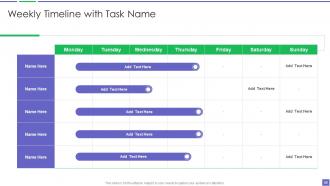
Slide 62: This slide shows Weekly Timeline with Task Name.
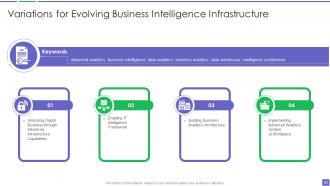
Slide 63: This slide presents Variations for Evolving Business Intelligence Infrastructure.
Slide 64: This is Our Mission slide with related imagery and text.
Slide 65: This is Our Team slide with names and designation.
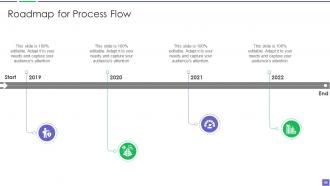
Slide 66: This slide showcases Roadmap for Process Flow.
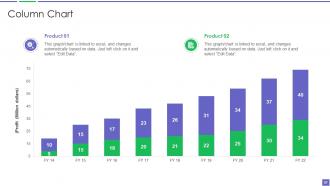
Slide 67: This slide displays Column chart with two products comparison.
Slide 68: This slide shows Post It Notes. Post your important notes here.
Slide 69: This slide contains Puzzle with related icons and text.
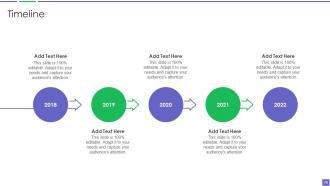
Slide 70: This is a Timeline slide. Show data related to time intervals here.
Slide 71: This is a Thank You slide with address, contact numbers and email address.
Building Business Analytics Architecture Powerpoint Presentation Slides with all 76 slides:
Use our Building Business Analytics Architecture Powerpoint Presentation Slides to effectively help you save your valuable time. They are readymade to fit into any presentation structure.









FAQs for Building Business Analytics Architecture
Honestly, break it down into five main pieces. Data storage comes first - you need somewhere for all your raw info to live, like a data lake or warehouse. Processing is next for cleaning everything up. The fun part is analytics where your BI tools and machine learning actually do their thing. Dashboards and visualizations go in the presentation layer (otherwise nobody sees your work, which sucks). Security and governance wrap around it all. I'd start by figuring out what gaps you have vs what's already working - that's gonna tell you where to spend your money first.
Oh man, you're so right to focus on this! Getting all your data sources talking to each other is honestly what separates good analytics from trash. I mean, if you're only seeing pieces from your CRM here, some marketing data there - you're basically flying blind. The magic happens when everything connects properly. Your CRM, ERP, all those marketing platforms... suddenly you can actually see what's really going on with your business. It's wild how much clearer decisions become. I'd start by just listing out what systems you've got now and figure out where the biggest gaps are. Trust me, fix those first and you'll see the difference immediately.
Honestly, cloud computing has pretty much become essential for analytics these days. The scalability is huge - you can fire up tons of processing power when you need it, then dial it back down. No massive upfront costs either. AWS, Azure, and Google all have these ready-made analytics tools that'd take your team months to build from scratch. What I really love though is how everyone can access the same data from anywhere now. Makes collaboration way easier. Oh, and my buddy at work always says this - just move one project to the cloud first to see how it goes before you commit to everything.
Look, build those data quality checks into your pipeline right from day one - don't try to add them later. Automated validation at every ingestion point is key: duplicate detection, format checks, completeness stuff. I've watched so many teams skip this and then panic when their dashboards look insane. Also set up clear data lineage so you can actually trace problems back to where they started. Oh, and start documenting your most critical sources first, then work backwards from there. Trust me on this one.
Honestly? Kafka's your best bet - literally every dev I work with swears by it now. Apache Storm and Flink are solid too for stream processing. If you need crazy fast queries, Redis is amazing (though pricey at scale). Cloud stuff like AWS Kinesis works great if you're already there. Here's the thing though - figure out what actually needs to be real-time first. Like, does it really need sub-second response or can you get away with near real-time? That'll save you tons of headache later. Map your data flow and see where the bottlenecks really are.
Honestly, the visualization tool you pick can make or break whether people actually use your analytics. Interactive dashboards are way better than static reports - users can dig into their own questions instead of just looking at whatever charts you made. Tableau and Power BI are solid choices since they let people slice data themselves (basically turns everyone into mini-analysts). But here's the thing - if it's too complicated, nobody touches it. You want something intuitive that still has depth when people need it. Oh, and definitely ask your users what they're comfortable with before deciding. No point building something they'll avoid.
So ML basically automates all that pattern-finding stuff that would take you ages to do manually. You're not just seeing what already happened - now you can actually predict what's coming next. The speed difference is insane, honestly. These algorithms chew through massive datasets while traditional tools are still loading. They get smarter over time too, which is pretty cool since you don't have to keep tweaking everything. I'd say start with something simple like predicting which customers might bail. That way you can see if it's worth the investment before going all-in.
First thing - encrypt everything, both stored data and stuff moving around. Multi-factor authentication isn't optional anymore, trust me on that. Role-based access is huge too, only give people what they actually need for their jobs. Network segmentation helps isolate your analytics stuff from everything else. Data masking for sensitive info, obviously. Oh and audit logging - you'll want to know who's poking around in what data. Regular security checks catch problems early. Automated monitoring flags weird access patterns. Start with your most critical datasets and work from there. The access management failures I've seen... yikes.
First thing - get your leadership actually on board, not just pretending to care. Train people on basic data stuff so they're not totally lost when looking at numbers (seriously, most places skip this step completely). Make the data easy for everyone to access, not locked away with the nerds in analytics. Pick metrics that actually matter to the business. Set up regular meetings where you ask "what's the data saying here?" Oh, and your system better be fast - nobody's waiting three days for answers. Start with just one team and see how it goes before rolling it out everywhere.
Ugh, the data explosion hits you like a truck. Your system that handled 100 users fine? Completely dies at 10,000. Performance goes to hell - queries crawl, servers crash, and don't even get me started on trying to connect different tools together. Storage bills will make you cry (learned that one the hard way). Then your team implodes because marketing wants different dashboards than sales, and everyone's fighting over metrics. Honestly, just plan for triple your current users right now. Go cloud-native if you can, and set up some basic data rules before it all becomes chaos.
Dude, this is honestly make-or-break stuff. Most analytics projects crash because IT builds what they think is cool while business teams sit there like "this doesn't solve anything we actually need." You want both sides talking from day one - not just some kickoff meeting and then radio silence. Business people know the real problems, IT knows how to build things that won't fall apart. I've watched companies blow serious money on systems that look impressive but nobody touches. Keep everyone in the loop throughout, not just at the beginning and end.
Look at both the tech stuff and business results - you need both angles. Track your data quality, model accuracy, system uptime. Then measure ROI on projects, how fast people can make decisions, and whether anyone actually uses the insights you're giving them. That last part kills me - I've seen so many beautiful dashboards just sitting there collecting dust. User adoption rates matter too, plus how quickly people can get answers. Honestly? Start small with maybe 3-5 metrics, don't go crazy tracking everything. You can always add more later once things are running smoothly.
Look, you gotta build compliance right into your analytics setup from the start - can't just slap it on later when things break. Need solid data lineage tracking, audit trails, plus encryption everywhere. GDPR wants you deleting data while SOX demands you keep it forever (makes total sense, right?). Finance companies deal with even crazier rules about where data lives and who touches it. Honestly, just map out what regulations hit you early on, then design everything around those rules. Your pipelines, storage, access controls - all of it. Trust me, discovering gaps during an audit is not fun.
Look, predictive analytics is basically your crystal ball for business decisions. You can actually see what's coming instead of just reacting to whatever hits you. Customer gonna churn? You'll know weeks ahead. Demand spike coming? Already planned for it. Honestly, it makes you feel pretty smart when you nail a forecast. Operations get so much smoother when you're not constantly putting out fires. My advice? Don't try to boil the ocean right away - just pick something simple like sales forecasting first. Once that works, you can expand everywhere else.
Honestly, streaming analytics and edge computing are where things are headed - processing data right where it happens instead of shuttling everything around. AI automation is getting pretty solid at surfacing insights without you having to dig through reports manually (thank god). Most teams are going cloud-native now because on-prem stuff is just a headache. Data mesh is picking up steam too, letting different teams own their data instead of everything being centralized. There's also this composable analytics thing - basically mix-and-match components rather than one giant platform. I'd start playing with streaming capabilities first, then see how AI could cut down your manual work.
-
I am glad to have come across Slideteam. I was searching for some unique presentations and templates for my business. There are a lot of alternatives available here.
-
Delighted to see unique and eye-catching PowerPoint designs that are so easy to customize.