


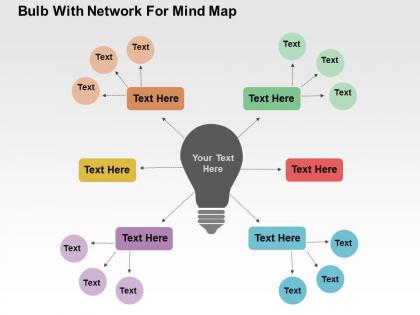
Bulb with network for mind map flat powerpoint design




Try Before you Buy Download Free Sample Product
 Impress Your
 Audience
 100%
100% Editable
 Save Hours
 of Time


Our Bulb With Network For Mind Map Flat Powerpoint Design are generous to the core. They freely contribute to your cause.
People who downloaded this PowerPoint presentation also viewed the following :
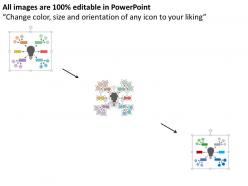
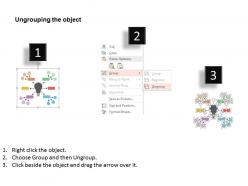
Bulb with network for mind map flat powerpoint design with all 4 slides:
Your thoughts and our Bulb With Network For Mind Map Flat Powerpoint Design will click as a duo. They will make an exemplary combination.
FAQs for Bulb with network for mind map
Key components of a Bulb Network Mind Map include central concept nodes, branching pathways, hierarchical layers, visual connectors, and thematic color coding. These elements enhance understanding by creating intuitive knowledge structures, enabling rapid pattern recognition, and facilitating comprehensive concept visualization, with educators and business analysts finding that this approach significantly improves information retention and strategic planning outcomes.
Bulb Network Mind Maps enhance team brainstorming by creating visual connections between ideas, encouraging non-linear thinking, and enabling simultaneous contribution from all participants. These collaborative tools streamline idea generation, improve information retention, and foster creative associations, with many organizations finding that visual mapping techniques ultimately deliver more innovative solutions and stronger team engagement during creative sessions.
**INPUT**: What are some best practices for designing an effective Bulb Network Mind Map for educational purposes? **OUTPUT**: Best practices include using clear visual hierarchies, consistent color coding, concise keywords over lengthy text, logical branching patterns, and strategic white space distribution. These design elements enhance comprehension by streamlining information flow, minimizing cognitive overload, and enabling faster knowledge retention, with many educational institutions finding that well-structured mind maps ultimately deliver improved learning outcomes and student engagement.
Bulb Network Mind Maps facilitate critical thinking by encouraging visual connections between concepts, promoting non-linear thought processes, and enabling systematic analysis of complex problems through interconnected idea clusters. These visual frameworks help learners identify patterns, evaluate relationships between different variables, and develop comprehensive solutions by mapping cause-and-effect relationships, ultimately enhancing analytical skills and strategic decision-making capabilities.
Different colors and shapes in a Bulb Network Mind Map significantly enhance information retention by creating visual associations, improving memory encoding, and enabling faster pattern recognition. These design elements help learners categorize complex information more effectively, with educational institutions and corporate training programs finding that color-coded hierarchies and distinctive shapes increase comprehension rates by up to 40%, ultimately delivering stronger knowledge retention and more engaging learning experiences.
**INPUT**: What software tools or apps are recommended for creating digital Bulb Network Mind Maps? **OUTPUT**: Recommended software tools for digital Bulb Network Mind Maps include MindMeister, XMind, Lucidchart, Coggle, and SimpleMind, each offering collaborative features and customizable templates. These platforms streamline brainstorming sessions by enabling real-time collaboration, cloud synchronization, and visual formatting options, with many organizations finding that digital mind mapping enhances team productivity and idea development across projects. [Word count: 56 words]
Bulb Network Mind Maps enhance project management by visually organizing tasks, defining team roles, establishing clear dependencies, and creating transparent communication pathways throughout the project lifecycle. Through strategic visualization, project managers streamline resource allocation, track milestone progress, and facilitate cross-functional collaboration, with many organizations finding that this approach significantly reduces project delays and improves team accountability.
Visual tools like Bulb Network Mind Maps enhance learning by improving memory retention, reducing cognitive load, boosting creativity, increasing engagement, and facilitating pattern recognition. These psychological benefits work by activating both visual and verbal processing pathways, helping learners organize complex information more effectively, while many educators find that students demonstrate improved comprehension and problem-solving abilities.
Bulb Network Mind Maps significantly enhance engagement compared to traditional linear note-taking by incorporating visual elements, interconnected pathways, and spatial relationships that activate multiple cognitive channels simultaneously. Through color-coding, branching structures, and graphical representations, these mind maps stimulate both analytical and creative thinking processes, with many educators and professionals finding that participants retain information longer and demonstrate increased participation during brainstorming sessions.
Collaboration enables diverse perspectives, shared expertise, and comprehensive idea generation when developing Bulb Network Mind Maps, with team members contributing unique insights, identifying connections others might miss, and ensuring thorough coverage of complex topics. Through collaborative mapping, organizations streamline brainstorming sessions, enhance creative problem-solving, and build collective ownership of strategic initiatives, ultimately delivering more robust solutions and stronger team alignment.
Bulb Network Mind Maps have transformed presentations across healthcare systems documenting patient care pathways, financial institutions mapping risk assessment processes, and marketing teams visualizing campaign interconnections. These visual frameworks enable stakeholders to grasp complex relationships instantly, reduce meeting times by up to 40%, and enhance collaborative decision-making, with many organizations finding that strategic clarity ultimately accelerates project timelines and improves outcomes.
Different educational levels adapt Bulb Network Mind Maps by adjusting complexity, scope, and application methods to match cognitive development stages. Primary schools use simple, colorful versions for basic concept connections, secondary education employs them for subject integration and critical thinking, while tertiary institutions leverage sophisticated networks for research synthesis and complex theoretical frameworks, ultimately enhancing learning outcomes across all academic levels.
Common challenges include organizing interconnected ideas logically, determining appropriate connection strengths, avoiding information overload, maintaining visual clarity, and balancing detail with overview perspective. These obstacles can be overcome through starting with core concepts before adding connections, using consistent color coding and symbols, breaking complex networks into manageable sections, and iteratively refining the map structure, with many professionals finding that regular practice and template usage significantly streamlines the creation process.
Bulb Network Mind Maps accommodate different learning styles through visual hierarchies with colors and symbols for visual learners, collaborative discussions and verbal explanations for auditory learners, and interactive drag-and-drop functionality for kinesthetic learners. These adaptable frameworks enable educators and trainers to create comprehensive learning experiences that engage diverse audiences simultaneously, ultimately delivering improved knowledge retention and enhanced educational outcomes across various institutional settings.
Analyzing a completed Bulb Network Mind Map reveals hierarchical information relationships, knowledge gaps, connection patterns between concepts, and potential areas for strategic expansion or consolidation. These insights enable organizations to streamline decision-making processes, enhance knowledge management systems, and identify operational efficiencies, with many finding that visual pattern analysis ultimately delivers improved resource allocation and competitive advantage.
-
Wonderful templates design to use in business meetings.
-
Excellent design and quick turnaround.