

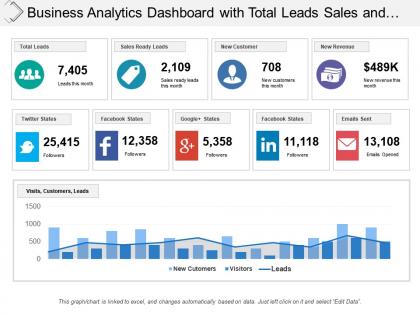
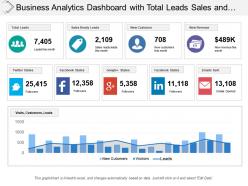
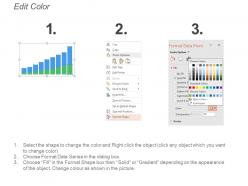
Business analytics dashboard with total leads sales and new customers




Try Before you Buy Download Free Sample Product
 Impress Your
 Audience
 100%
100% Editable
 Save Hours
 of Time


Identify factors causing disparity with our Business Analytics Dashboard With Total Leads Sales And New Customers. Create identical conditions for all.
People who downloaded this PowerPoint presentation also viewed the following :
Business analytics dashboard with total leads sales and new customers with all 6 slides:
Enjoy the convenience of our Business Analytics Dashboard With Total Leads Sales And New Customers. Convey your ideas exactly as you imagined,

FAQs for Business analytics dashboard with total leads sales
Business analytics dashboards should prioritize revenue growth metrics, customer acquisition costs, conversion rates, operational efficiency indicators, and profit margins as core KPIs. These metrics enable organizations to track performance across sales, marketing, and operations simultaneously, with many companies finding that combining financial indicators with customer behavior data delivers comprehensive insights for strategic decision-making and competitive advantage.
Data visualization enhances business decision-making by transforming complex datasets into intuitive charts, graphs, and interactive dashboards that reveal patterns, trends, and correlations instantly. Through visual analytics, executives can identify market opportunities, track performance metrics, and spot operational inefficiencies more quickly, with many organizations finding that visual dashboards reduce analysis time while improving strategic accuracy.
Real-time data transforms business analytics dashboards by enabling immediate decision-making, live performance monitoring, instant anomaly detection, and dynamic trend analysis. Through continuous data streaming, organizations can respond to market changes within minutes, identify operational issues as they occur, and optimize customer experiences in real-time, ultimately delivering competitive advantage and agile business operations.
Businesses can tailor dashboards by customizing metrics, visualizations, access levels, and reporting frequencies based on each stakeholder's role and priorities. Executive dashboards emphasize high-level KPIs and strategic insights, while operational teams require detailed performance metrics and real-time data, ultimately enabling targeted decision-making and improved organizational alignment across all levels.
Common pitfalls include overwhelming users with too many metrics, poor data visualization choices, lack of real-time integration, insufficient user training, and misaligned KPIs with business objectives. Many organizations find that cluttered interfaces, slow loading times, and inadequate mobile optimization significantly reduce dashboard adoption rates, ultimately limiting data-driven decision making and competitive advantage.
Effective business analytics dashboard tools include Tableau, Power BI, Qlik Sense, Looker, and Google Data Studio, each offering distinct visualization capabilities and integration options. These platforms streamline data analysis by providing real-time insights, customizable reporting features, and seamless connectivity across multiple data sources, with many organizations finding that strategic tool selection significantly enhances decision-making speed and operational efficiency.
Predictive analytics integrates into business dashboards through machine learning algorithms, real-time data processing, automated forecasting models, and interactive visualization tools that display future trends alongside current metrics. These systems enable organizations to anticipate market changes, optimize resource allocation, and proactively address operational challenges, with many financial services and retail companies finding significantly enhanced decision-making capabilities.
Best practices for maintaining data integrity in analytics dashboards include implementing automated data validation rules, establishing regular audit schedules, creating standardized data entry protocols, maintaining backup systems, and deploying real-time monitoring alerts. These practices streamline accuracy by preventing errors at source, detecting anomalies quickly, and ensuring consistent reporting standards, with many organizations finding that proactive integrity measures ultimately deliver more reliable insights and faster decision-making capabilities.
User experience design significantly influences dashboard effectiveness by enhancing data visualization clarity, streamlining navigation workflows, and ensuring intuitive interface layouts that minimize cognitive load. Through strategic UX principles, organizations create dashboards that enable faster decision-making, reduce training requirements, and improve user adoption rates, with many companies finding that well-designed interfaces ultimately deliver higher analytical engagement and more actionable business insights.
**INPUT**: What metrics are most useful for tracking customer engagement through dashboards? **OUTPUT**: Essential customer engagement metrics include session duration, page views per visit, click-through rates, conversion rates, and customer lifetime value. These metrics enable businesses to streamline customer experiences by identifying behavior patterns, optimizing touchpoints, and personalizing interactions, with many retail and financial services organizations finding that comprehensive engagement tracking ultimately delivers higher retention rates and competitive advantage. [Word count: 58 words]
Dashboards aid in identifying operational inefficiencies by providing real-time visibility into key performance metrics, bottlenecks, and resource utilization patterns across departments. Through interactive visualizations and automated alerts, organizations can quickly spot workflow delays, underperforming processes, and cost overruns, while benchmarking against industry standards, ultimately enabling faster corrective actions and improved operational efficiency.
Regular dashboard audits, stakeholder feedback collection, performance metric reviews, technology updates, and data source validation ensure long-term relevance. Organizations across retail, healthcare, and financial services find that quarterly assessments, user training programs, and strategic alignment reviews help dashboards evolve with changing business needs, ultimately delivering sustained competitive advantage and operational efficiency.
Businesses can leverage A/B testing results by integrating conversion metrics, user behavior patterns, statistical significance indicators, and performance comparisons directly into their analytics dashboards. Through real-time visualization of test outcomes, organizations streamline decision-making processes, optimize marketing campaigns, and enhance user experiences, with many companies finding that dashboard-integrated A/B insights accelerate product development cycles.
Cloud-based business analytics dashboards deliver real-time data access, scalable infrastructure, cost-effective deployment, enhanced collaboration capabilities, and automatic software updates. These platforms streamline decision-making by enabling remote access across organizations, reducing IT overhead, and facilitating seamless data sharing, with many enterprises finding that cloud solutions ultimately enhance operational efficiency while minimizing infrastructure investments.
Dashboards facilitate cross-departmental collaboration by providing unified data views, real-time performance metrics, and shared KPI tracking that eliminate information silos. Through centralized reporting platforms, teams across sales, marketing, finance, and operations can access consistent insights, align strategic priorities, and make coordinated decisions, ultimately streamlining communication and enhancing organizational efficiency.
No Reviews