

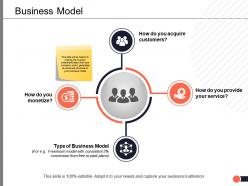
Business model ppt powerpoint presentation visual aids outline





Try Before you Buy Download Free Sample Product
 Impress Your
Audience
 100%
Editable
 Save Hours
of Time


Contemplate your choices with our Business Model Ppt Powerpoint Presentation Visual Aids Outline. Evaluate each available alternative.
People who downloaded this PowerPoint presentation also viewed the following :
Business model ppt powerpoint presentation visual aids outline with all 10 slides:
Give a clear cut explanation of important contents with our Business Model Ppt Powerpoint Presentation Visual Aids Outline. It helps create a glossary.


FAQs for Business model ppt powerpoint presentation
Key components of an effective business model presentation include value proposition, target market, revenue streams, cost structure, competitive advantage, and implementation timeline. These elements work together by clearly defining your market opportunity, demonstrating financial viability, and showcasing operational feasibility, with many investors and stakeholders finding that comprehensive presentations significantly enhance credibility and funding success.
Visual storytelling enhances business model presentations by transforming complex data into compelling narratives, incorporating infographics and process flows, and creating emotional connections with stakeholders. Through strategic use of charts, diagrams, and visual metaphors, presenters streamline complex concepts while maintaining audience engagement, ultimately delivering clearer understanding and stronger buy-in from investors and decision-makers.
Audience analysis shapes every element of a business model presentation, from content depth and technical language to visual design and key messaging priorities. By understanding stakeholder interests, expertise levels, and decision-making criteria, presenters can tailor financial projections, market analysis, and strategic frameworks accordingly, ultimately delivering more persuasive presentations that resonate with specific audience needs and drive desired outcomes.
Common pitfalls include overcomplicating the value proposition, lacking clear revenue streams, ignoring market validation, presenting unrealistic financial projections, and failing to address competitive threats. These presentation weaknesses undermine investor confidence by creating confusion rather than clarity, with many entrepreneurs finding that simplified, data-backed narratives highlighting scalable operations and validated market demand ultimately deliver stronger stakeholder engagement and funding success.
Tailoring business model presentations requires adjusting content focus, messaging depth, and value propositions for each audience's specific interests and decision-making criteria. Investors prioritize financial projections and scalability metrics, partners focus on collaboration opportunities and mutual benefits, while clients emphasize solutions to their pain points, with successful presentations ultimately delivering targeted messaging that resonates with stakeholder priorities and accelerates business relationships.
Data visualization tools enhance business model presentations by transforming complex financial data, market analysis, customer segments, and revenue projections into compelling charts, graphs, interactive dashboards, and infographic elements. These tools enable presenters to communicate value propositions more effectively, demonstrate market opportunities with greater clarity, and showcase competitive advantages through visual storytelling, ultimately delivering more persuasive presentations that resonate with stakeholders and investors.
Best practices for structuring a business model presentation include starting with a compelling problem statement, clearly defining your value proposition, outlining revenue streams, detailing target market segments, and presenting financial projections with realistic timelines. These elements work together by building a logical narrative flow that addresses investor concerns, demonstrates market viability, and showcases scalability potential, ultimately delivering credibility and competitive positioning.
Case studies and examples significantly enhance business model credibility by providing concrete proof of concept, demonstrating real-world viability, and showcasing measurable outcomes from similar implementations. These validation tools enable investors and stakeholders to visualize practical applications, reduce perceived risk through documented success stories, and build confidence in scalability, with many organizations finding that specific industry examples accelerate decision-making processes.
Key metrics include revenue projections, customer acquisition costs, lifetime value ratios, market penetration rates, and operational efficiency indicators. These financial and performance measures demonstrate scalability and profitability potential, with investors and stakeholders finding that clear growth trajectories, competitive advantages, and sustainable unit economics ultimately drive engagement and funding decisions.
Balancing technical details with high-level insights requires layering information strategically, starting with executive summaries and diving deeper progressively, using visual hierarchies to separate complex data from key takeaways. Successful presentations often employ the "pyramid principle," where critical business outcomes lead discussions, while technical specifications support conclusions through appendices or detailed sections, ultimately enabling stakeholders to grasp both strategic implications and operational feasibility.
Recommended tools include PowerPoint, Canva, Prezi, Google Slides, and Keynote, each offering templates, visual elements, and collaborative features. These platforms streamline presentation creation by providing customizable layouts, interactive components, and professional design options, with many organizations finding that combining multiple tools enhances storytelling capability and delivers more compelling investor presentations.
Feedback from previous presentations informs improvements by identifying content gaps, clarifying messaging effectiveness, and highlighting audience engagement patterns. Through systematic analysis of stakeholder questions, concerns, and suggestions, presenters can refine their value propositions, strengthen financial projections, and enhance visual storytelling, ultimately delivering more compelling and investor-ready presentations.
Essential design elements include clear visual hierarchy, consistent branding, strategic use of white space, readable typography, and cohesive color schemes that align with your brand identity. These elements work together by enhancing comprehension, maintaining audience attention, and reinforcing credibility, with many organizations finding that well-designed presentations significantly improve stakeholder engagement and investment outcomes.
A compelling narrative drives engagement by transforming complex business concepts into relatable stories that connect emotionally with investors, stakeholders, and partners. Through storytelling techniques, presenters illustrate market problems, solution journeys, and customer success scenarios, making abstract business models tangible and memorable while building trust and inspiring confidence in growth potential.
**INPUT**: What strategies can be employed to address questions or objections during the presentation? **OUTPUT**: Effective strategies include anticipating common concerns, preparing data-driven responses, acknowledging valid points before redirecting, and using visual aids to clarify complex concepts. These approaches enhance credibility by demonstrating thorough preparation and market understanding, while creating collaborative dialogue that builds investor confidence and transforms potential objections into opportunities for deeper engagement. **Word count: 54 words**
No Reviews