

Business operations analysis proposal powerpoint presentation slides




Try Before you Buy Download Free Sample Product
 Impress Your
 Audience
 100%
100% Editable
 Save Hours
 of Time


Conducting an overall business review helps in determining the stand and position of a company in the global competitive market space. Customer retention, regular evaluation of financial performance, and product strategy are essential for establishing the strength and weaknesses of a company's policy. These Business Operations Analysis Proposal PowerPoint Presentation Slides allow you to exhibit the list of expert services that you provide for the brand analysis needs of your clients. Mention your key deliverables to the clients like a unique brand proposition, strong distribution network, pricing strategy, and market strategy with the help of our performance evaluation PPT template. Carry out an extensive survey of marketing and supply chain activities by taking the aid of our content-specific PPT slide. Discover the issues in successful business functions with these professional proposal templates. Utilize this work assessment PPT slideshow to highlight your plan of action for effective enterprise management like research, planning, feedback collection, and implementation. Define the scope of your services to garner the attention of your audience and compel them to engage with your company with these PowerPoint templates. Use our time frame layout to give your proposal an authentic outlook and showcase the period required for each task with this organizational analysis PPT theme. You can easily illustrate the financial budget and investment that your clients need to mark for your services with this business review PowerPoint visual. Eliminate any concern of your customers by giving a clear and concise account of your company's vision, mission, goals, objectives, achievements, and awards with the assistance of this market strategy PPT proposal. Take advantage of our customizable proposal slides to display the client testimonials and case studies of your past projects and gain the confidence of your clients. With this strategic assessment PPT graphic, engage in market analysis and stay ahead of the competition. Download this PowerPoint presentation and share your terms and conditions in an organized and informative way.
People who downloaded this PowerPoint presentation also viewed the following :
Content of this Powerpoint Presentation
Slide 1: This slide introduces Business Operations Analysis Proposal. State Client name, Submission date, User assigned.
Slide 2: This slide displays Cover Letter.
Slide 3: This slide displays Table of Contents of the presentation.
Slide 4: This slide displays Table of Contents.
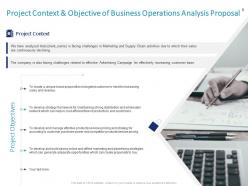
Slide 5: This slide describes Project Context & Objective.
Slide 6: This slide showcases Table of Contents.
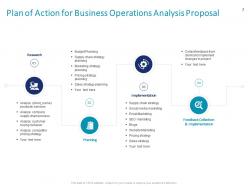
Slide 7: This slide displays Plan of Action for Business Operations Analysis Proposal
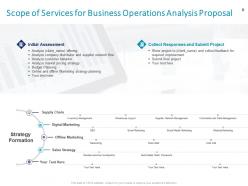
Slide 8: This slide showcases Scope of Services.
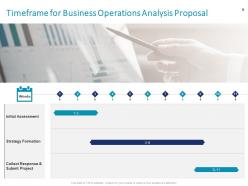
Slide 9: This slide shows Timeframe.
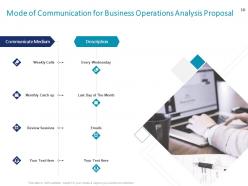
Slide 10: This slide displays Mode of Communication.
Slide 11: This slide showcases Table of Contents containing- Your Investment.
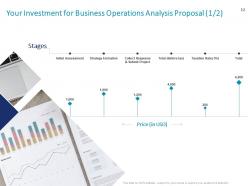
Slide 12: This slide displays Investment details.
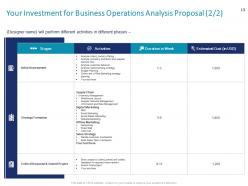
Slide 13: This slide displays Investment details.
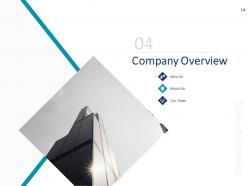
Slide 14: This slide displays Table of Contents with- Company Overview, Why Us, About Us, Our Team.
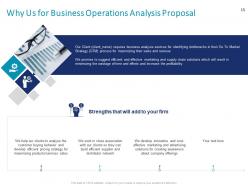
Slide 15: This slide presents reasons for choosing us for Business Operations Analysis Proposal
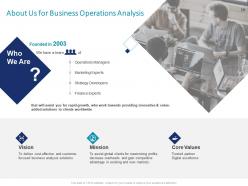
Slide 16: This is About Us slide to showcase Company specifications.
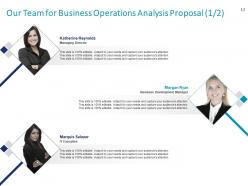
Slide 17: This is Our Team slide.
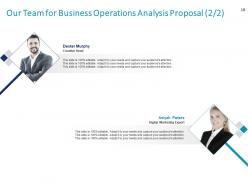
Slide 18: This is Our Team slide with Names and Designations.
Slide 19: This slide displays Table of Contents containing- Our Past Experience, Client Testimonials, Case Study.
Slide 20: This slide shows Client Testimonials.
Slide 21: This slide shows Client Testimonials with names and designations.
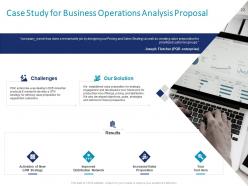
Slide 22: This slide displays Case Study.
Slide 23: This slide shows Table of Contents with- Statement of Work & Contract.
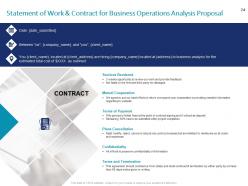
Slide 24: This slide describes Statement of Work & Contract for Business Operations Analysis Proposal.
Slide 25: This slide displays Table of Contents with- Next Steps
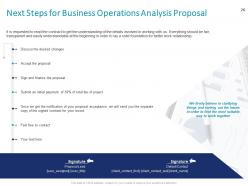
Slide 26: This slide shows Next Steps for Business Operations Analysis Proposal. It is requested to read the contract to get the understanding of the details involved in working with us. Everything should be fair, transparent and easily understandable at the beginning in order to lay a solid foundation for better work relationship.e
Slide 27: This is Follow Us slide.
Slide 28: This is Contact Us slide with Email address, Company address and Contact number.
Slide 29: This is Icons Slide for Business Operations Analysis Proposal.
Slide 30: This slide is titled as Additional Slides for moving forward.
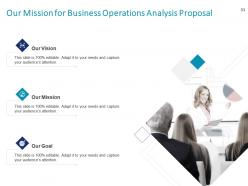
Slide 31: This is Our Mission slide with Mission and Goal.
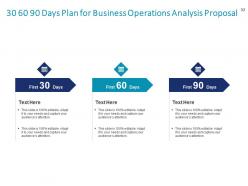
Slide 32: This is 30 60 90 Days Plan slide.
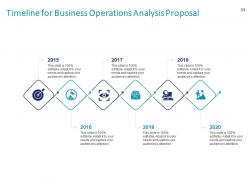
Slide 33: This slide shows Timeline process.
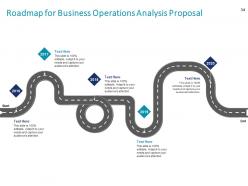
Slide 34: This slide depicts Roadmap process.
Business operations analysis proposal powerpoint presentation slides with all 34 slides:
Use our Business Operations Analysis Proposal Powerpoint Presentation Slides to effectively help you save your valuable time. They are readymade to fit into any presentation structure.



FAQs for Business operations analysis proposal
Honestly, start with the basics that actually matter - revenue growth, what you're spending to get customers, and your profit margins. Cash flow is super critical too (I've seen profitable companies tank because they ran out of cash). Track things like how fast inventory moves, employee productivity, customer satisfaction. But here's the thing - don't get crazy with tracking everything. Pick maybe 5-7 KPIs that you'll actually use to make decisions. Figure out what success looks like for your business first, then find the numbers that'll help you get there.
Honestly, start with automating your most annoying data pulls - that alone will save you hours. Then grab something like Tableau or Power BI for dashboards that actually update themselves. No more pulling reports from five different systems manually (ugh). Machine learning stuff can catch patterns you'd totally miss - some results are genuinely surprising. Cloud platforms are great too since your team can work on the same data without that whole "which version is current?" mess. Oh, and real-time dashboards are kind of addictive once you get used to them.
Look, data analytics is like having X-ray vision for your workflow. Track stuff like cycle times and throughput rates - you'll spot bottlenecks that aren't obvious from just watching operations day-to-day. It's honestly like getting a traffic report for your processes. The patterns it reveals are wild - you'll see which steps consistently drag or where work gets stuck. I'd start by mapping your key metrics first (boring but necessary). Then hunt for the biggest gaps between what you expect vs what actually happens. That's where your bottlenecks are hiding.
So basically, take your SWOT and turn each part into actual action items. Double down on what you're already crushing - like if logistics is your thing, go all-in on speed. Weaknesses? That's your fix-it list (and honestly, usually the longest one). New opportunities show you what capabilities to start building next. Threats are trickier - they tell you where you need backup plans before stuff hits the fan. The whole point is making it actionable instead of just another analysis that sits in some folder forever. Don't overthink it.
So for business ops stuff, I'd say start with Excel - honestly can't go wrong there. Still use it constantly even though there's fancier options now. Google Sheets works too if you're more cloud-based. When you get into bigger datasets, Power BI or Tableau are lifesavers for visualizations. Process mapping is where Lucidchart shines, though Visio's fine if you already have it. Project tracking? Asana's pretty solid, or Monday.com. Don't overthink it though - Excel plus one good viz tool will cover like 80% of what you need. Add other stuff later when you actually hit those specific walls.
Honestly, customer feedback is like having a cheat sheet for your business. It shows you what's actually broken vs what you *think* might be wrong. Data doesn't sugarcoat things either - even when your instincts say everything's fine, the numbers might tell a totally different story. Look for patterns in complaints to spot bottlenecks early. Use that info to fix the annoying stuff before it gets worse. Oh, and don't go crazy tracking every possible metric right away. Pick like 3-4 key things and nail those first.
Honestly, the worst part is always messy data - like it's spread across five different systems and half of it's wrong. Teams get super defensive too when you start looking at their work. Can't blame them really. Then everyone keeps asking you to analyze "just one more tiny thing" until your project balloons into chaos. My suggestion? Pick one process to start with and actually talk to the people doing the work before you begin. Oh, and spend way more time cleaning data than you think you need to. Trust me on that one.
Honestly, charts and dashboards will save your sanity when you're drowning in spreadsheet data. I learned this the hard way after spending way too many late nights squinting at rows of numbers. Bar charts are perfect for comparing different metrics side by side. Line graphs? Great for tracking stuff over time. Heat maps show you patterns you'd never catch otherwise - they're actually pretty cool once you get the hang of them. The trick is figuring out what decision you need to make first, then picking whatever visual makes that insight super obvious to whoever's looking at it.
First thing - figure out what you're actually trying to achieve strategically. Otherwise you'll just drown in random data that doesn't matter. Connect every operational metric back to those bigger goals. Like, how does inventory turnover help your growth targets? Customer satisfaction scores should tie to retention stuff. I've watched way too many teams get completely lost in Excel hell because they skipped this step. Your ops and strategy people need to talk regularly - can't stress this enough. Oh, and measure things that actually make a difference, not just whatever's easiest to track. That's where most companies mess up.
First thing - figure out what metrics actually matter to you. Don't just hoover up every data point you can find. Pull from your financial systems, operational stuff, customer feedback, employee input. Numbers are cool but they're kinda meaningless without the story behind them. Oh, and set up regular collection schedules so you can track changes over time instead of random snapshots. Honestly, the worst thing you can do is wait for "perfect" data - that'll never happen. Just start with whatever you've got and make it better as you learn what works.
First thing - figure out where your time and money actually disappear, not where you think they do. Map everything out. Talk to your frontline people because honestly, they catch stuff managers totally miss. Hunt for bottlenecks and work that's getting done twice for no reason. What's your biggest money drain? Usually it's labor, materials, or overhead - tackle those first. Oh, and measure everything before you change anything. Otherwise you're just guessing if it worked. I learned this the hard way, but data shows you patterns like when things get messy or where you're bleeding resources.
Dude, engaged employees will literally boost your productivity by 20-30% - it's wild how much difference it makes. They actually spot problems faster and come up with decent solutions instead of just complaining. You'll get way better data too since they're not half-assing reports or fudging numbers (which happens more than managers want to admit, honestly). When something breaks, engaged teams help you figure out why instead of playing dumb. Short version: crappy engagement equals crappy operational data. Fix one, you'll probably fix the other.
So you basically get x-ray vision for your whole supply chain - you'll catch bottlenecks and weird cost drains before they become disasters. Data shows you which suppliers are always running late, where inventory just sits around eating money, routes that cost way more than they should. Honestly, demand forecasting patterns alone are worth the effort. You can figure out better warehouse spots, find chances to bundle shipments together. Oh and mapping your current setup first is key - then track stuff like lead times and what it costs to hold inventory. Sounds boring but it's like detective work for logistics nerds.
Okay so first things first - protect that data like your life depends on it. Privacy breaches will absolutely wreck you. Before diving into any analysis, ask yourself who's gonna be affected by your findings. Will your recommendations screw over employees or hurt certain communities? That stuff matters. Be upfront about your methods and don't hide data limitations - honestly, transparency saves everyone headaches later. Oh, and resist the urge to cherry-pick results just because they support what leadership wants to hear. Build those ethical guardrails right from the start, not as an afterthought.
So continuous improvement is basically about making your analysis process better over time. You know that Plan-Do-Check-Act cycle? Apply it to how you actually study business processes. Find what's broken in your current methods, try something new, see if it works, then keep what's good. Honestly, it's kinda meta - you're analyzing how you analyze stuff. But it works! Pick one workflow that's been bugging you lately. Maybe your data collection is messy or your reports take forever. Run a quick PDCA test on just that one thing this week. You'll be surprised how much smoother things get when you're intentional about improving your own systems.
-
Colors used are bright and distinctive.
-
The Designed Graphic are very professional and classic.
-
Unique design & color.