

Painéis de desempenho de negócios com novos clientes e lucro bruto





Try Before you Buy Download Free Sample Product
 Impress Your
Audience
 100%
Editable
 Save Hours
of Time


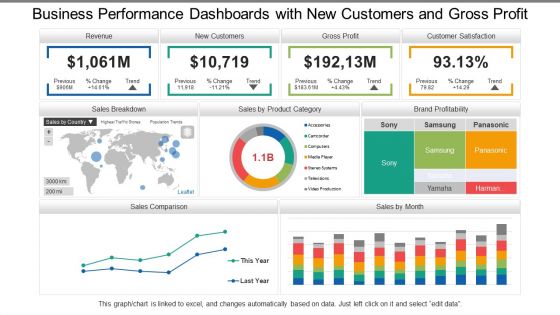
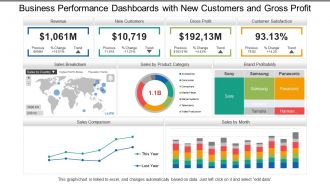
Planeje conosco e esclareça as pessoas sobre o preconceito por meio de nossos painéis de desempenho de negócios com novos clientes e lucro bruto. As etapas são mostradas aqui no projeto PPT, preenchidas com tabelas e gráficos, barras e gráficos de classificação, mapas e texto para refletir sobre o desempenho do seu negócio. Valide seus planos e explique as técnicas sobre como essas metas podem ser alcançadas e o prazo em que essas metas devem ser cumpridas. Use as áreas de texto para organizar seus dados de acordo com o plano. Aqui na SlideTeam, estamos continuamente nos empenhando em melhores ideias para criar melhores resultados e acompanhar passo a passo com o mercado e os rivais, nosso slide PPT reflete o mesmo. Delineie seu curso de ação futuro com nossos Painéis de desempenho de negócios com novos clientes e lucro bruto. Explique como você pretende fazer isso.
People who downloaded this PowerPoint presentation also viewed the following :
Conteúdo desta apresentação em PowerPoint
Painéis de desempenho de negócios com novos clientes e lucro bruto com todos os 6 slides:
Brainstorm com o melhor com nossos painéis de desempenho de negócios com novos clientes e lucro bruto. Você receberá atenção exclusiva.
FAQs for Business Performance Dashboards Snapshot With New Customers
Honestly, start simple - pick 5-7 metrics that actually move the needle for your business. Real-time data is clutch because who wants to make decisions off stale numbers? Your visualizations should be dead simple to read. I can't tell you how many dashboards I've seen that look like a data explosion happened. When something looks weird, you'll want to drill down fast. Oh, and arrange everything so it tells a story - trends and problems should jump out at you. My old boss used to say "if it takes more than 30 seconds to understand, it's garbage." Maybe harsh but pretty accurate.
Start with clean data and put validation rules everywhere in your pipeline. Automated quality checks are a lifesaver - they'll catch weird stuff, missing values, all that before it hits your dashboard. Way easier than debugging later when everything's already broken. Cross-check your dashboard numbers against the actual source systems regularly too. Oh, and make someone own each data source - can't have accountability floating around nowhere. Build the verification right into your workflow from day one instead of crossing your fingers and hoping it works.
Look, visualization makes or breaks a dashboard honestly. Raw numbers are basically useless - your brain can't process them quickly. But a line chart? You'll spot trends immediately instead of staring at boring tables forever. Good visuals help you figure out what's urgent and reduce mental overload. Plus stakeholders won't fall asleep looking at charts (spreadsheets are brutal). The trick is matching the right chart to what you're trying to show. Ask yourself what decision you need to make first, then pick something that makes the answer super obvious.
Honestly, it totally depends on what you're tracking. Most operational stuff works fine with daily updates - gives you fresh info without driving everyone crazy. Financial dashboards? Maybe weekly or monthly is plenty. But customer service metrics need to be real-time or hourly because, let's be real, angry customers aren't gonna wait around. I'd say start with whatever feels right for how your team actually works. You can always tweak it later based on how often people are actually checking the thing and whether they need newer data to make calls.
Don't cram everything onto one screen - that's the
No Reviews