


Business Process Relationship Mapping And Assessment




Try Before you Buy Download Free Sample Product
 Impress Your
 Audience
 100%
100% Editable
 Save Hours
 of Time


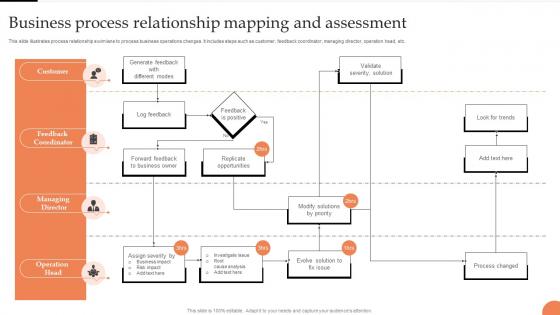
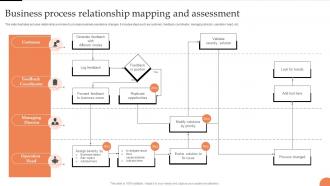
This slide illustrates process relationship swim lane to process business operations changes. It includes steps such as customer, feedback coordinator, managing director, operation head, etc.
People who downloaded this PowerPoint presentation also viewed the following :
Business Process Relationship Mapping And Assessment with all 6 slides:
Use our Business Process Relationship Mapping And Assessment to effectively help you save your valuable time. They are readymade to fit into any presentation structure.





FAQs for Business Process Relationship
Business process mapping delivers enhanced operational efficiency, improved communication across departments, reduced costs, better compliance management, and streamlined workflow optimization. Through visual documentation and analysis, organizations can identify bottlenecks, eliminate redundancies, and accelerate decision-making processes, with many companies finding that systematic mapping ultimately provides competitive advantage and measurable productivity gains.
Process mapping improves team communication by creating visual workflows that standardize terminology, clarify roles and responsibilities, and eliminate ambiguity around procedures. These visual representations enable teams to identify bottlenecks, coordinate handoffs more effectively, and align on objectives, with many organizations finding that standardized process maps reduce miscommunication by up to 40%.
Recommended process mapping tools include Lucidchart, Microsoft Visio, Bizagi, Creately, and Draw.io, each offering different strengths for visualization and collaboration. These platforms streamline documentation by providing drag-and-drop interfaces, real-time collaboration features, and integration capabilities, with many organizations finding that cloud-based solutions enhance team accessibility while delivering faster process analysis and improved operational transparency.
**INPUT**: How do you identify and prioritize processes that need mapping? **OUTPUT**: Identify processes for mapping by focusing on those with frequent bottlenecks, high error rates, regulatory requirements, customer touchpoints, and significant resource consumption. Prioritize based on business impact, complexity levels, and strategic importance, with many organizations finding that customer-facing processes like order fulfillment and claims processing deliver immediate efficiency gains and competitive advantage. [Word count: 54 words]
High-level process maps provide a broad overview of major process steps and decision points, while detailed process maps include granular activities, specific roles, systems, and workflows. Organizations typically start with high-level mapping to identify improvement opportunities and bottlenecks, then create detailed maps for implementation planning, ultimately enabling more targeted process optimization and resource allocation.
Business process mapping helps identify bottlenecks by visualizing workflow steps, revealing delays, resource constraints, and inefficient handoffs between departments. Through detailed mapping, organizations can pinpoint where processes slow down, analyze cycle times, and discover redundant activities, ultimately enabling targeted improvements that streamline operations and enhance overall productivity.
Stakeholder involvement ensures comprehensive process understanding, identifies pain points, validates accuracy, and secures buy-in for improvements across departments. Through collaborative workshops and interviews, organizations capture diverse perspectives from employees, managers, and customers, ultimately delivering more effective process redesigns and smoother implementation of changes.
Process mapping facilitates better compliance by creating visual documentation of workflows, identifying control points, establishing audit trails, and standardizing procedures across operations. Through detailed process visualization, organizations streamline regulatory reporting, minimize compliance gaps, and ensure consistent adherence to industry standards, with many financial services and healthcare institutions finding that mapped processes significantly reduce audit preparation time while enhancing regulatory transparency.
Common pitfalls include creating overly complex maps, failing to involve actual process participants, focusing on ideal rather than current processes, using inconsistent symbols, and neglecting regular updates. These mapping errors often result in documentation that doesn't reflect reality, with many organizations finding that involving frontline employees and maintaining simplicity delivers more accurate, actionable process insights.
Process maps streamline training and onboarding by providing visual workflows, standardized procedures, role-specific responsibilities, and clear decision points that new employees can easily follow. Organizations like manufacturing companies and financial services firms use these maps to accelerate learning curves, ensure consistency across departments, and reduce onboarding time, ultimately delivering faster productivity and enhanced operational efficiency.
Accuracy in process mapping is ensured through stakeholder interviews, direct observation of workflows, data validation against actual performance metrics, cross-functional team reviews, and iterative refinement cycles. These techniques work together by capturing multiple perspectives, identifying discrepancies between documented and actual processes, and enabling continuous improvement, with many organizations finding that combining observation with stakeholder input delivers the most comprehensive and reliable process maps.
Business process mapping contributes to continuous improvement by identifying bottlenecks, redundancies, and inefficiencies within existing workflows, enabling organizations to pinpoint specific areas for enhancement. Through visual documentation and analysis, companies streamline operations, reduce cycle times, and eliminate waste, with manufacturing and healthcare organizations finding that mapped processes deliver measurable cost reductions and improved service quality.
Process mapping integrates seamlessly with techniques like SWOT analysis, root cause analysis, value stream mapping, stakeholder analysis, and gap analysis. This strategic combination enhances organizational understanding by identifying inefficiencies, streamlining workflows, and optimizing resource allocation, with many companies finding that integrated approaches deliver comprehensive insights and sustainable competitive advantage.
Visuals enhance process maps by improving comprehension, reducing cognitive load, and enabling faster decision-making across diverse stakeholders. Through strategic use of color coding, icons, and flowchart elements, organizations streamline communication, identify bottlenecks more effectively, and accelerate training processes, with many finding that visual clarity ultimately drives higher employee engagement and operational efficiency.
Successful business process mapping implementations include Amazon's warehouse automation optimization, Toyota's lean manufacturing workflows, Starbucks' customer service standardization, McDonald's kitchen operations efficiency, and Bank of America's loan approval streamlining. These organizations revolutionize operational efficiency by eliminating bottlenecks, reducing processing times, and enhancing customer experiences, ultimately delivering significant cost savings and competitive advantage in their respective markets.
-
These stunning templates can help you create a presentation like a pro.
-
Stunning collection! With a wide variety of options available, I was able to find a perfect slide for my presentation. Thank you, SlideTeam!