


80658191 style layered horizontal 3 piece powerpoint presentation diagram infographic slide






Try Before you Buy Download Free Sample Product
 Impress Your
Audience
 100%
Editable
 Save Hours
of Time


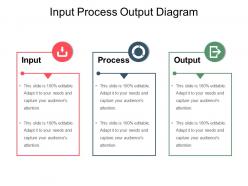
Get the deal going with our Input Process Output Diagram Sample Of Ppt Presentation. Encourage folks to focus on areas of agreement.
80658191 style layered horizontal 3 piece powerpoint presentation diagram infographic slide with all 5 slides:
Our Input Process Output Diagram Sample Of Ppt Presentation ensure calm all around. They help avoid any disturbance.


FAQs for 80658191 style layered horizontal 3 piece powerpoint presentation
So basically there's three parts - Input, Process, and Output. Input is whatever's going into your system (data, materials, whatever). Then Process is all the stuff that happens to change it. Output's your end result. Honestly, I always think of it like cooking - you throw ingredients in, do a bunch of steps, and get your final dish. Makes it way easier to visualize. Start with figuring out what you actually want to map, then just work backwards from there. Once you know your desired output, the rest kinda falls into place. Pretty simple framework once you get the hang of it.
So basically, IPO diagrams make your whole process visible, which is huge for catching waste. You'll spot bottlenecks right away - it's like finally cleaning your room and realizing why you could never find anything. Look for redundant steps or missing handoffs between people. The best part? You start questioning everything: "Do we even need this input?" or "Does this step actually help our output?" Honestly, most processes have way more fat than you think. Map it out first before trying to fix anything - saves you from solving the wrong problems.
Honestly, IPO diagrams pop up everywhere once you notice them. Software teams use them for system design, manufacturers map production workflows with them. Business processes across tons of industries too - healthcare for patient protocols, finance for transactions, restaurants even sketch out kitchen operations this way. I mean, it's kind of wild how versatile they are. Simple concept but works for everything from app design to supply chains. Next time you're stuck on a messy process, just sketch one out. You'd be amazed how much clearer things get when you map inputs, what happens, then outputs.
Honestly, just flip it around - figure out your end goal first, then work backwards. Ask yourself "what would completely break this if it wasn't there?" I do this thing where I pretend I'm explaining the process to someone who knows nothing about it. What are the absolute must-haves versus the stuff that's just... nice? Like when I'm meal planning (weird example but whatever), I focus on the ingredients that actually make or break the dish. Try sketching it out if you're visual. Challenge every single input - "okay, what dies if this disappears?" You'll be surprised how much fluff you can cut.
Dude, just use whatever you've got! I always start with PowerPoint since it's on my laptop anyway - the SmartArt thing actually works fine for IPO stuff. Draw.io is solid if you want something free online. Lucidchart's pretty smooth for team projects since everyone can edit at once. Honestly though? I've drawn these on napkins before and they worked just as well - it's literally three boxes with arrows between them. Don't overthink the tool. Focus on getting your inputs, processes, and outputs right first. Visio's overkill unless your company already pays for it.
Honestly, less is more with these diagrams. Just focus on your main inputs, what actually transforms in the middle, and the outputs people care about. Don't get sucked into mapping every tiny detail - that's overkill. I'd group similar inputs together and keep the process to maybe 2-3 big steps max. The moment you're drowning in arrows and boxes everywhere, you've gone too far. Start broad first. Then if you really need to, make separate detailed diagrams for the major pieces later. But seriously, stakeholders just want the big picture most of the time.
Yeah, IPO diagrams totally work for both! Manufacturing's pretty straightforward - raw materials go in, assembly line does its thing, finished products come out. Service processes are where it gets interesting though. Customer support workflows, loan approvals, even restaurant orders - they all follow that same input-process-output pattern. Honestly, I think service processes are actually more fun to map out because they're messier. Like, a customer complaint might bounce between three departments before it's resolved. But that's the whole point - you can still trace what goes in (angry customer) and what should come out (happy customer, hopefully). The process part just gets more complex with services than manufacturing.
Honestly, IPO diagrams are pretty clutch for getting your project straight. You map out what resources you need, the processes that'll transform them, and what you're actually delivering. Think of it like a GPS for workflow - sounds cheesy but it works. When stakeholders just want the "what goes in, what comes out" without diving into technical stuff, these diagrams are perfect. They also catch scope creep fast since any new inputs or outputs jump right out at you. I'd throw one into your next kickoff meeting. Gets everyone on the same page about what we're actually doing here.
Oh man, IPO diagrams are lifesavers for this stuff. Think of them like a universal translator - input, process, output. Super simple. Everyone gets it, even the non-techy people. I use them all the time in meetings to align on requirements or when I'm walking clients through workflows. They're honestly perfect for debugging too - like when your outputs are totally wrong and you need to figure out where things went sideways. The whole jargon thing just disappears. Next time you're stuck explaining something complex, just sketch one out real quick. You'll be shocked how much clearer everything becomes. Trust me on this one.
Honestly, most people mess up by being way too vague - like writing "data" instead of "customer order form." Be specific enough that someone else gets it. Don't cram every tiny detail into your process box though, that's missing the point. Keep it high-level. Also check that your inputs actually connect to what the process does - I've seen diagrams where they're totally random lol. Oh and start simple first. You can always add more complexity later if you really need to, but usually you won't.
You know what's great about IPO diagrams? They basically force you to map out every single step, so bottlenecks become super obvious. I mean, you can literally see where stuff piles up or slows down. Track your inputs and outputs - you'll spot mismatches right away, like when one step cranks out way more than the next can handle. It's honestly like getting a bird's eye view of traffic instead of sitting in it. Time each step on your diagram first though. That'll show you exactly where the delays are happening, plus which steps eat up too many resources.
Feedback loops are basically how your system learns from itself - the output circles back to tweak your inputs or processes. Draw them as arrows going backward from output to input. Like when a thermostat reads the temp and adjusts accordingly. Most real systems do this self-correction thing constantly. Without feedback loops, your IPO diagram is just a straight line, which honestly feels pretty incomplete. When mapping your process, ask "does this output make us change something next time?" That's where you need those backward arrows. Makes the whole thing way more realistic.
So basically, take your IPO model and chop it into sprint pieces instead of doing everything upfront. Each sprint becomes its own little input-process-output cycle - you gather what you need, build something, then ship it. What's neat is the stuff you deliver often feeds right back into planning the next sprint. It's this constant loop that keeps getting better. Start by figuring out your current sprint's IPO setup, then use retros to tweak things for next time. Way more flexible than the traditional approach, honestly.
Look, good visuals are everything for IPO diagrams - they stop people from getting lost in the mess. I always use a color system: blue for inputs, green for process, orange for outputs. Makes it super easy to follow. White space is your friend here, nobody wants to stare at cramped text. Make those arrows chunky and obvious too, way bigger than feels right at first. Clean fonts help a ton. The whole point is someone should "get it" in like 5 seconds of looking. Oh, and honestly? Simple beats fancy every single time when you're trying to explain processes.
So when your process changes, start by figuring out exactly what's different in that middle step. Update the process box first with your new steps. Then check if you need different inputs now or if your outputs changed too - honestly, this part can get messy because everything's connected. Save your old diagram somewhere before you start messing with it (trust me on this one). Once you think you've got it right, run it by your team to catch anything you missed. It's kinda like dominoes - change one thing and suddenly three other pieces need tweaking.
-
Visually stunning presentation, love the content.
-
Thanks for all your great templates they have saved me lots of time and accelerate my presentations. Great product, keep them up!