Grab 10+ Donut Charts PPT slides
-
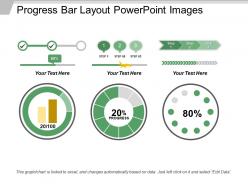 36124885 style division donut 3 piece powerpoint presentation diagram infographic slide
You can download this PPT completely free of cost. You just have to edit the data in a pre-designed format and present it. You can insert fonts and icons to this ready-made slide. All these slides are fully compatible with Google Slides. This presentation can be downloaded in JPG and PDF formats. It can be viewed in the 16:9 ratio widescreen size and the ratio of 4:3 standard screen size.
-
 23383020 style division donut 4 piece powerpoint presentation diagram infographic slide
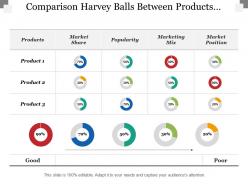
Presenting this set of slides with name - Comparison Harvey Balls Between Products Market Share Popularity. This is a four stage process. The stages in this process are Differentiation, Comparison, Compare.
-
 19207106 style division donut 3 piece powerpoint presentation diagram infographic slide
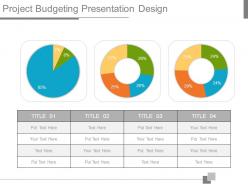
Presenting project budgeting presentation design. This is a project budgeting presentation design. This is a three stage process. The stages in this process are project, budgeting, finance, strategy, marketing, management.
-
 17266541 style division donut 6 piece powerpoint presentation diagram infographic slide
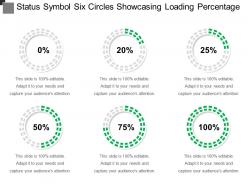
Presenting status symbol six circles showcasing loading percentage. This is a status symbol six circles showcasing loading percentage. This is a six stage process. The stages in this process are status symbol, status icon.
-
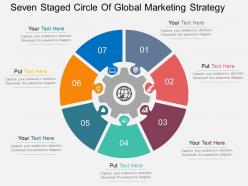 85558 style circular loop 7 piece powerpoint presentation diagram infographic slide
Pre-designed Presentation templates. Enough space available to enter text and its related points in the PPT slide. Completely editable content. Pictures do not pixelate when projected on Widescreen. Easy to insert company logo, trademark or name. This PPT Slide is available in both Standard and Widescreen slide size. Easy and quick downloading process. Compatible with multiple formats like JPEG, PDF and Google slides.
-
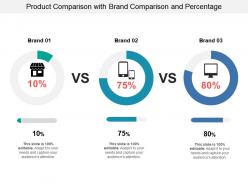 56217986 style division donut 3 piece powerpoint presentation diagram infographic slide
Presenting this set of slides with name - Product Comparison With Brand Comparison And Percentage. This is a three stage process. The stages in this process are Business Swot Analysis, Product Comparison And Competitive Landscape, Competitive Analysis, Swot Analysis Competitor Comparison.
-
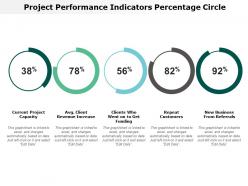 52216179 style division donut 5 piece powerpoint presentation diagram infographic slide
Presenting this set of slides with name - Project Performance Indicators Percentage Circle. This is a five stage process. The stages in this process are Percentage Circle, Percentage Round, Pie Chart.
-
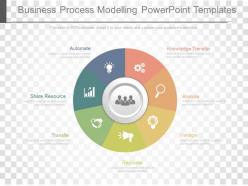 96348759 style division donut 7 piece powerpoint presentation diagram infographic slide
Presenting, business process modeling PowerPoint templates. Edit the color schemes in the circular layout. Move or replace the icons used. Project it on a widescreen without pixilation. Reinstate the content with your own business information. Include your brand’s logo or name in the slide background. Works well with the Google Slides. Availed for every small and large business firm. Downloading it will release its full version which allows you to use in 4:3 standard and full-screen version 16:9.
-
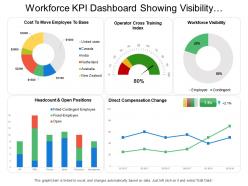 6070909 style essentials 2 financials 5 piece powerpoint presentation diagram infographic slide
Presenting this set of slides with name - Workforce Kpi Dashboard Showing Visibility Headcount And Direct Compensation Change. This is a five stage process. The stages in this process are Staff, Personnel, Workforce.
-
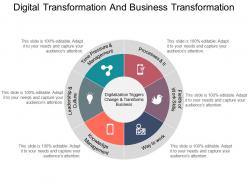 55955439 style division donut 6 piece powerpoint presentation diagram infographic slide
Presenting digital transformation and business transformation good ppt example. This is a digital transformation and business transformation good ppt example. This is a six stage process. The stages in this process are digital transformation.
-
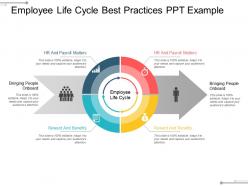 62031098 style division donut 4 piece powerpoint presentation diagram infographic slide
Presenting employee life cycle best practices ppt example. This is a employee life cycle best practices ppt example. This is a four stage process. The stages in this process are employee relationship management, employee life cycle, employee relations.
-
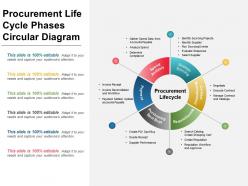 35317172 style division donut 6 piece powerpoint presentation diagram infographic slide
Presenting procurement life cycle phases circular ppt slide. This is a procurement life cycle phases circular ppt slide. This is a six stage process. The stages in this process are procurement, purchasing, ?bidding.
-
 35047863 style division donut 3 piece powerpoint presentation diagram infographic slide
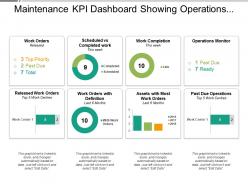
Presenting this set of slides with name - Maintenance Kpi Dashboard Showing Operations Monitor And Past Due Operations. This is a three stage process. The stages in this process are Maintenance, Preservation, Conservation.
-
 16675754 style division donut 4 piece powerpoint presentation diagram infographic slide
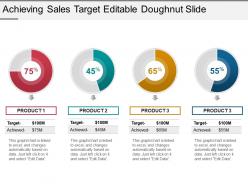
The biggest advantage of downloading this sales target achievement doughnut PPT diagram is the use of excel linked chart. Include your business related statistics over linked excel sheet and get it directly updated in the PPT design. Design allows full editing. PPT can be quickly downloaded into JPEG and PDF formats. You can open the design with Google Slides and Microsoft PowerPoint software.
-
 54959374 style division donut 7 piece powerpoint presentation diagram infographic slide
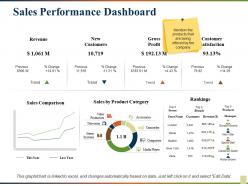
Presenting this set of slides with name - Sales Performance Dashboard. This is a seven stage process. The stages in this process are Revenue, New Customers, Gross Profit, Customer Satisfaction, Rankings .
-
 44784490 style essentials 2 financials 6 piece powerpoint presentation diagram infographic slide
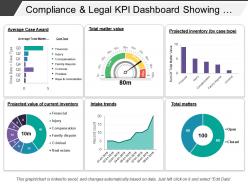
Presenting this set of slides with name - Compliance And Legal Kpi Dashboard Showing Total Matter Value. This is a six stage process. The stages in this process are Compliance And Legal, Legal Governance, Risk Management.
-
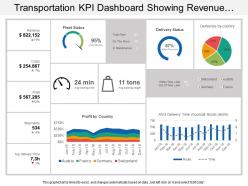 38249005 style division pie 3 piece powerpoint presentation diagram infographic slide
Presenting KPI dashboard snapshot showing revenue costs profit fleet status slideshow. Change PowerPoint structure, font, text, color and design as per your requirements. Easy to input data with excel linked charts, just right to click to input data. This presentation theme is totally attuned with Google slides. Easy conversion to other software’s like JPG and PDF formats. Image quality of these PPT diagram remains the unchanged even when you resize the image or portray on large screens.
-
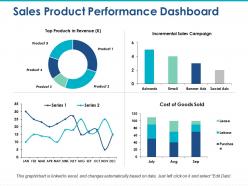 22156387 style division donut 4 piece powerpoint presentation diagram infographic slide
Providing sales product performance dashboard incremental sales campaign presentation template with editing preference as images, icons, colors, text and layout can be edit as required. PowerPoint design can be downloaded and save into JPG and PDF format. High resolution ensures no pixel break. PPT diagram downloadable in standard and widescreen view. Fully adjustable slide as works well with Google slides. Easy to adjust and present when required. Quick to share message effectively.
-
 89803841 style division donut 6 piece powerpoint presentation diagram template slide
Entirely editable PowerPoint slide with great picture quality. Compatible with several software programs like JPEG or PDF. Access to include or exclude any element as per the business requirement. Customization of PowerPoint diagram and text is permitted according to your preference. Presentation layout available in standard as well as in widescreen slide size. PPT design can be downloaded with different nodes and stages.
-
 33172886 style division donut 4 piece powerpoint presentation diagram infographic slide
Presenting status symbol four circles loading round progress bar 1. This is a status symbol four circles loading round progress bar 1. This is a four stage process. The stages in this process are status symbol, status icon.
-
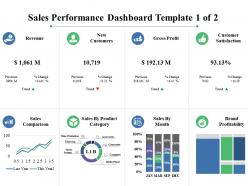 56744903 style division donut 4 piece powerpoint presentation diagram infographic slide
Providing sales performance dashboard revenue new customers PowerPoint template. PPT graphic can be shared in standard and widescreen view. High resolution picture quality ensures no pixel break up even when shared with large set of audience. Presentation slide is adaptable with Google slides. Magnificent to share business communication effectively. PPT slide is available with different nodes and stages. PowerPoint design can be edited as needed and change into JPG and PDF format.
-
 45743070 style division donut 12 piece powerpoint presentation diagram infographic slide
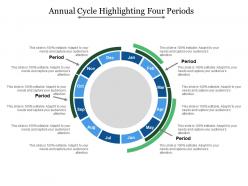
Presenting this set of slides with name - Annual Cycle Highlighting Four Periods. This is a twelve stage process. The stages in this process are Annual Cycle, Annual Process, Annual Performance Review.
-
 44508802 style division donut 3 piece powerpoint presentation diagram infographic slide
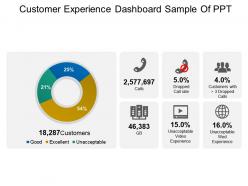
Presenting customer experience dashboard snapshot sample of PPT. This PPT slide offers you plenty of space to put in titles and sub titles. High resolution-based presentation layout does not change the image even after resizing. This presentation icon is fully compatible with Google slides. Quick downloading speed and simple editing options in color text and fonts.PPT icons can easily be changed into JPEG and PDF applications. This diagram has been designed for entrepreneurs, corporate and business managers.
-
 67820209 style division donut 4 piece powerpoint presentation diagram infographic slide
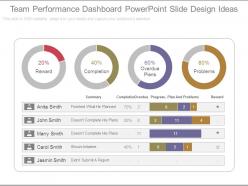
Presenting team performance dashboard powerpoint slide design ideas. This is a team performance dashboard powerpoint slide design ideas. This is a four stage process. The stages in this process are reward, completion, overdue plans, problems, summary, completion, overdue, progress, plan and problems, reward.
-
 3695805 style division donut 4 piece powerpoint presentation diagram infographic slide
Presenting business management dashboard diagram power point graphics. This is a business management dashboard diagram power point graphics. This is a four stage process. The stages in this process are property system, crm system, asset system, finance system.
-
 31998879 style essentials 2 financials 6 piece powerpoint presentation diagram infographic slide
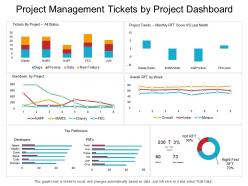
Presenting this set of slides with name - Project Management Tickets By Project Dashboard. This is a six stage process. The stages in this process are Project Proposal, Project Plan, Project Management.
-
 76101345 style division donut 5 piece powerpoint presentation diagram infographic slide
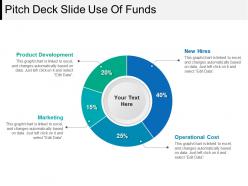
Presenting Pitch Deck Slide Use Of Funds PowerPoint Show. You can make the necessary alterations in the font color, font size, and font style of the slide as it is entirely customizable. The color of the text and background can be formatted. You can add or edit text anywhere in the PowerPoint template. Its compatibility with Google Slides makes it accessible at once. You can transform and save the slide in PDF and JPG formats as well. Get this high-quality slide to add value to your presentation and present it in front of thousands of people on standard screen and widescreen.
-
 33667467 style division donut 3 piece powerpoint presentation diagram infographic slide
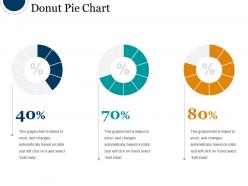
Presenting Donut Pie Chart PowerPoint Slide Presentation Examples which is completely editable. Open and save your presentation in various formats like PDF, JPG, and PNG. This template is compatible with Google Slides which makes it easily accessible at once. This slide is available in both 4:3 and 16:9 aspect ratio. Alter the font, color, font size, and font types of the slides as per your needs.
-
 8846920 style concepts 1 growth 2 piece powerpoint presentation diagram template slide
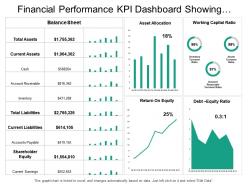
Presenting this set of slides with name - Financial Performance Kpi Dashboard Showing Asset Allocation Balance Sheet. This is a two stage process. The stages in this process are Financial Performance, Financial Report, Financial Review.
-
 23859997 style essentials 2 financials 5 piece powerpoint presentation diagram template slide
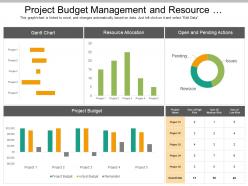
Presenting this set of slides with name - Project Budget Management And Resource Allocation Dashboard. Amazing picture quality as pixels don’t break even on large display. Preference gives personal touch to the Presentation slide with business symbol, name and image. Simple to adjust PowerPoint design as changes accepted with color, text and shape. Matching PPT templates are downloadable with different nodes and stages. Presentation graphic can be displayed in standard and widescreen view. Easy to download and change into other format such as JPEG and PDF
-
 69181283 style circular loop 10 piece powerpoint presentation diagram infographic slide
We are proud to present our 0714 business consulting 10 business steps in circle powerpoint slide template. This business consulting diagram helps to explain the course or movement of information in a process. This diagram is ideal for data representation and can also be used to show stages of a business process.
-
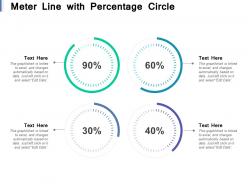 91388022 style division donut 4 piece powerpoint presentation diagram infographic slide
Presenting this set of slides with name - Meter Line With Percentage Circle. This is a four stage process. The stages in this process are Percentage Circle, Percentage Round, Pie Chart.
-
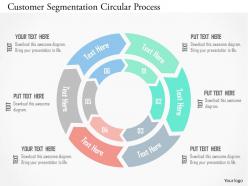 12029211 style circular concentric 6 piece powerpoint presentation diagram infographic slide
Professionally designed PowerPoint template slide. Easy and quick downloading. Guidance for executing the changes has been provided for assistance. Modify and personalize the presentation by including the company name and logo. Compatible with varied number of format options. Compatible with multiple software options available both online and offline. Widely used by business owners, strategists, marketers, investors, financial executives, professors and students.
-
 88960143 style division donut 3 piece powerpoint presentation diagram infographic slide
Presenting this set of slides with name - Budget Forecast Showing Income Of The Various Months And Savings. This is a three stage process. The stages in this process are Budget Forecast, Forecast Vs Actual Budget, Plan Vs Forecast.
-
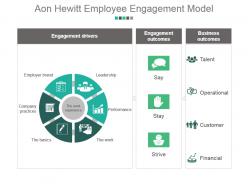 66610749 style division donut 6 piece powerpoint presentation diagram infographic slide
Presenting aon hewitt employee engagement model example of ppt presentation. This is a aon hewitt employee engagement model example of ppt presentation. This is a six stage process. The stages in this process are engagement drivers, engagement outcomes, business outcomes, employer brand, leadership, performance, company practices, talent, operational, customer, financial, strive, stay, say.
-
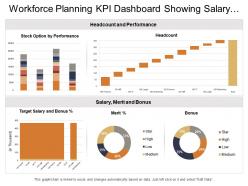 16374708 style essentials 2 financials 5 piece powerpoint presentation diagram infographic slide
Presenting this set of slides with name - Workforce Planning Kpi Dashboard Showing Salary Merit Bonus Headcount And Performance. This is a five stage process. The stages in this process are Staff, Personnel, Workforce.
-
 18421186 style division donut 6 piece powerpoint presentation diagram infographic slide
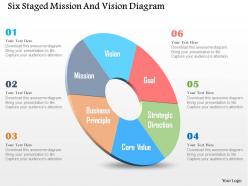
Exclusive and exquisite PPT presentation diagrams. Have the ability to keep the audience focused towards the vision and mission of business. Creates transparency of business objectives and goals. Allows insertion of business logos, trademarks and brand name. Loaded with high-quality patterns and graphics. Action oriented PPT presentation backgrounds.
-
 74997463 style division donut 9 piece powerpoint presentation diagram infographic slide
Presenting quality management in hospitals powerpoint slide presentation examples. This is a quality management in hospitals powerpoint slide presentation examples. This is a nine stage process. The stages in this process are emergency, department, length of stay, levels of care, post acute care, discharge, planning, finance, pi pmo, supply chain, pharmacy, physician, nursing, quality leads, it experts, clinical experts.
-
 51688801 style division donut 4 piece powerpoint presentation diagram infographic slide
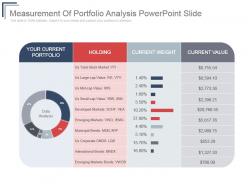
Presenting measurement of portfolio analysis PowerPoint slide. This layout is Compatible with Google slides. Easy to put in company logo, trademark or name; accommodate words to support the key points. Images do no blur out even when they are projected on large screen.PPT template can be utilized by sales and marketing teams and business managers. Instantly downloadable slide and supports formats like JPEG and PDF. Adjust colors, text and fonts as per your business requirements.
-
 8043592 style division donut 3 piece powerpoint presentation diagram infographic slide
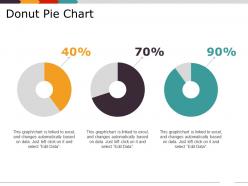
Presenting Donut Pie Chart Presentation Design PowerPoint slide. Easy to download PPT layout and can be saved in different formats like JPG, PDF and PNG. This PowerPoint slide is completely editable so you can modify, font type, font color, shape and image according to your requirements. This Google Slides compatible PPT is available in 4:3 and 16:9 aspect ratios.
-
 51050741 style division donut 4 piece powerpoint presentation diagram infographic slide
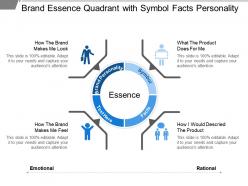
Presenting this set of slides with name - Brand Essence Quadrant With Symbol Facts Personality. This is a four stage process. The stages in this process are Brand Essence, Brand Equity, Competitive Analysis.
-
 65507121 style essentials 2 dashboard 3 piece powerpoint presentation diagram infographic slide
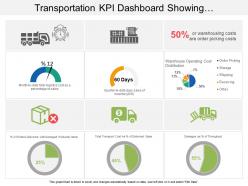
Presenting transportation KPI dashboard snapshot showing warehouse operating cost distribution PPT slide. Simple data input like company logo, name or trademark. User can edit the data in linked excel sheet and graphs and charts gets customized accordingly. Picture quality of these slides does not change even when project on large screen. Fast downloading speed and formats can be easily changed to JPEG and PDF applications. This template is suitable for marketing, sales persons, business managers and entrepreneurs.
-
 37778880 style circular loop 2 piece powerpoint presentation diagram infographic slide
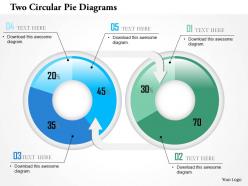
We are proud to present our two circular pie diagrams powerpoint template. Graphic of two circular pie diagrams has been used to design this power point template diagram. This PPT diagram contains the concept of result analysis. Use this PPT diagram for business and finance related presentations.
-
 8118314 style division donut 4 piece powerpoint presentation diagram infographic slide
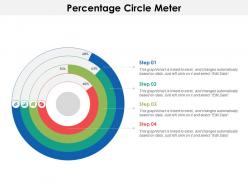
Presenting this set of slides with name - Percentage Circle Meter. This is a four stage process. The stages in this process are Percentage Circle, Percentage Round, Pie Chart.
-
 11756167 style cluster surround 6 piece powerpoint template diagram graphic slide
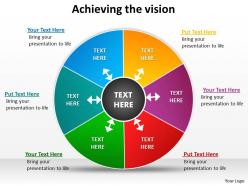
This template is skillfully designed and is completely editable to suit all the needs and requirements of the user. The color of the font, its size, style, and all other elements can be customized according to the user's desire The text in the PPT placeholder can be replaced with the desired information making this template highly flexible and adaptable as well. This template is also compatible with various Microsoft versions and formats like Google Slides, JPG, PDF, etc so the user will face no issue in saving it in the format of his choice.
-
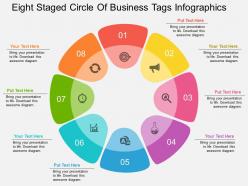 29920840 style circular loop 8 piece powerpoint presentation diagram infographic slide
Editable PPT Slide with professional icons. Compatible with numerous formats such as JPEG or PDF. Access to inclusion and exclusion of contents as per the business need. Provides a professional outlook to your PowerPoint presentation. Customization of each PowerPoint graphic and text according to your desire and want. Available in Widescreen slide size also. Choice to customize it with company name and logo. Perfect for business professionals, business analysts and strategists.
-
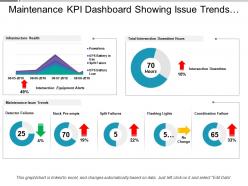 59630190 style division donut 3 piece powerpoint presentation diagram infographic slide
Presenting this set of slides with name - Maintenance Kpi Dashboard Showing Issue Trends And Infrastructure Health. This is a three stage process. The stages in this process are Maintenance, Preservation, Conservation.
-
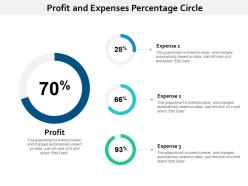 30184107 style division donut 3 piece powerpoint presentation diagram infographic slide
Presenting this set of slides with name - Profit And Expenses Percentage Circle. This is a three stage process. The stages in this process are Percentage Circle, Percentage Round, Pie Chart.
-
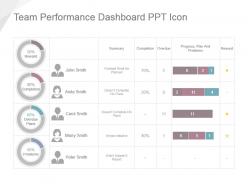 58317857 style division donut 4 piece powerpoint presentation diagram infographic slide
Presenting team performance dashboard ppt icon. This is a team performance dashboard snapshot ppt icon. This is a four stage. The Stages in this process are john smith, anita smith, carol smith, marry smith, peter smith, reward, completion, overdue plans, problems, summary, finished what he planned, doesn?t complete his plans, doesnt complete his plans, shows initiative, didnt submit a report, completion, overdue, progress, plan and problems, reward.
-
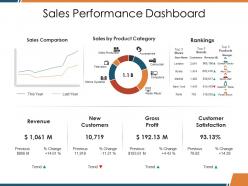 46497456 style division donut 2 piece powerpoint presentation diagram infographic slide
Presenting this set of slides with name - Sales Performance Dashboard Snapshot Ppt Deck. This is a two stage process. The stages in this process are Revenue, New Customers, Gross, Profit, Customer Satisfaction, Sales Comparison.
-
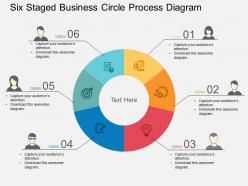 49654717 style circular loop 6 piece powerpoint presentation diagram infographic slide
We are proud to present our six staged business circle process diagram flat powerpoint design. Six staged business circle process diagram has been used to craft this power point diagram. This PPT diagram contains the concept of process flow. Use this PPT diagram for business and marketing related presentations.
-
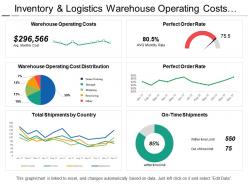 19714613 style essentials 2 financials 6 piece powerpoint presentation diagram infographic slide
Presenting inventory and logistics warehouse operating costs dashboard PPT slideshow. Editable charts, visuals, colors and text. Presentable and easy to comprehend info graphic format. The presentation template can be downloaded and saved in any desired format. Privilege of insertion of logo and trademarks for more personalization. Adaptable to wide screen view without the problem of pixilation. Can be used with Google slides. Easy to edit and customize as per your needs. Beneficial for industry professionals, managers, executives, researchers, sales people, etc.
-
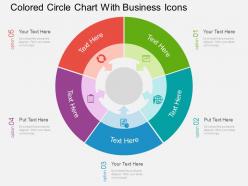 47967985 style division donut 5 piece powerpoint presentation diagram infographic slide
Presenting qg colored circle chart with business icons flat powerpoint design. This Point template diagram has been crafted with graphic of colored circle chart and icons. This PPT diagram contains the concept of business result analysis. This PPT diagram can be used for business and marketing related presentations.
-
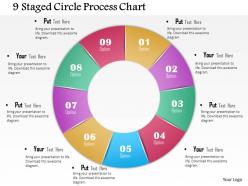 46323837 style circular loop 9 piece powerpoint presentation diagram infographic slide
We are proud to present our 0714 business consulting 9 staged circle process chart powerpoint slide template. This is a wonderful theme to show business steps. You have what it takes to grow. Take your team along by explaining your plans. Make your entire presentation visual by just cut-pasting your content in this diagram.
-
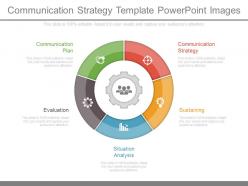 45593127 style division donut 5 piece powerpoint presentation diagram infographic slide
Beneficial for staff, donors, community, groups, social service workers. Use of professional stock photos and smart art design. Presentation slide is compatible with Google slide. PPT icon supports replacing and adding your own photo. Orientation of any graphic can be changed. Change color, font, and size with no loss of resolution.
-
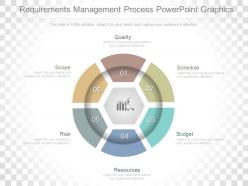 44908176 style circular loop 6 piece powerpoint presentation diagram infographic slide
An universal PowerPoint visual narratives clenching the content matter effectively , Manageable to PDF, JPG or other various file configurations, Arduous Presentation graphics for entreating the viewer’s, Scope available to replace dummy Presentation template diagrams, Erratic vector based visuals ,symbols, texts, pictures etc., Presenting your business idea through an immense quality visual options,The stages in this process are quality, schedule, budget, resources, risk, scope.
-
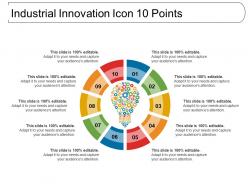 30979213 style division donut 10 piece powerpoint presentation diagram infographic slide
Presenting this Industrial Innovation Icon 10 Points template. The slide is fully adaptable in PowerPoint and other related software. You can alter the font type, size, diagram color, background color, etc. The slideshow is also compatible with Google Slides and can be saved in numerous image formats such as JPEG, PNG or document formats such as PDF without any difficulty. Moreover, high-quality graphics will ensure that picture quality does not decrease.
-
 97117147 style division donut 4 piece powerpoint presentation diagram infographic slide
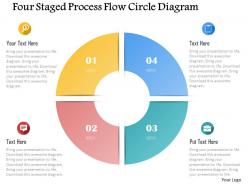
We are proud to present our 0115 four staged process flow circle diagram powerpoint template. Four staged process flows has been used to design this power point template. This PPT diagram contains the concept of data flow. Use this PPT for business and marketing data related topics in any presentation.
-
 78346647 style division donut 4 piece powerpoint presentation diagram infographic slide
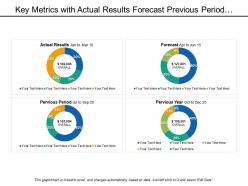
Presenting this set of slides with name - Key Metrics With Actual Results Forecast Previous Period And Year. This is a four stage process. The stages in this process are Key Metrics, Key Performance Indicator, Kpi.
-
 27854810 style division donut 4 piece powerpoint presentation diagram infographic slide
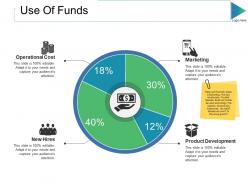
Presenting this set of slides with name - Use Of Funds Ppt Slides Clipart. This is a four stage process. The stages in this process are Operational Cost, New Hires, Product Development, Marketing, Business.


