

Call center kpi dashboard showing abandoned calls group calls group statistics






Try Before you Buy Download Free Sample Product
 Impress Your
Audience
 100%
Editable
 Save Hours
of Time


Every discipline is fully covered by our Call Center Kpi Dashboard Showing Abandoned Calls Group Calls Group Statistics. Get a great choice available at hand.
People who downloaded this PowerPoint presentation also viewed the following :
Content of this Powerpoint Presentation
Description:
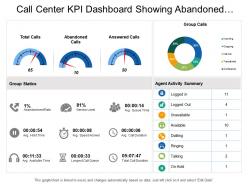
The image is a PowerPoint slide titled "Call Center KPI Dashboard Showing Abandoned Calls." It's designed to provide a snapshot of a call center's key performance indicators (KPIs). The dashboard is divided into three main sections:
1. Call Metrics:
Displaying gauges for Total Calls (65), Abandoned Calls (10), and Answered Calls (50), which provide a quick visual representation of call volume and service issues.
2. Group Statistics:
Showing detailed metrics such as a 1% Abandonment Rate and an 81% Service Level, along with average hold time (00:00:54), average speed of answer (00:00:08), average call duration (00:00:06), average available time (00:11:33), longest call queue time (00:00:33), and total call duration (05:07:47).
3. Agent Activity Summary:
Providing a count of agent statuses including Logged In (11), Logged Out (4), Unavailable (1), Available (10), Dialing (1), Ringing (1), Talking (2), and On Hold (1).
4. Additionally, there's a donut chart for Group Calls with percentages for Incoming, Outgoing, Internal, Transferred, and Conference calls.
Use Cases:
This type of slide can be utilized across various industries for multiple purposes:
1. Telecommunications:
Use: Monitoring call center operations and agent performance.
Presenter: Operations Manager.
Audience: Call center agents, management team.
2. Customer Service:
Use: Tracking customer support metrics and efficiency.
Presenter: Customer Service Manager.
Audience: Customer service representatives, supervisors.
3. Healthcare:
Use: Managing patient inquiry and support call centers.
Presenter: Healthcare Administrator.
Audience: Patient service representatives, clinic managers.
4. Banking and Finance:
Use: Overseeing call center activity for customer financial inquiries.
Presenter: Bank Center Manager.
Audience: Financial advisors, customer service agents.
5. Retail:
Use: Evaluating support for customer orders and service requests.
Presenter: Retail Operations Coordinator.
Audience: Retail staff, support teams.
6. IT Support:
Use: Assessing technical support response times and resolution efficiency.
Presenter: IT Support Team Leader.
Audience: IT support agents, technical team.
7. Travel and Hospitality:
Use: Monitoring booking and customer service call centers.
Presenter: Travel Operations Manager.
Audience: Reservation agents, travel consultants.
Call center kpi dashboard showing abandoned calls group calls group statistics with all 6 slides:
Cater to the buyer with our Call Center Kpi Dashboard Showing Abandoned Calls Group Calls Group Statistics. Convince them your goods have the desired class.


FAQs for Call center kpi dashboard showing abandoned calls group
For your call center dashboard, start with the big ones: First Call Resolution, Average Handle Time, and Customer Satisfaction Score. Service Level is crucial too - like hitting 80% of calls within 20 seconds. Average Wait Time and Agent Utilization round out the essentials. Honestly, I've seen teams drown in metrics before, so don't pile on everything at once. These six will give you what matters most for customer experience and keeping operations smooth. Once you've got those running well, then think about adding Net Promoter Score or Cost Per Call. But seriously, master the basics first.
Dude, real-time data is a game changer. You'll catch issues while they're actually happening instead of reading about yesterday's disasters in some report. When call volumes suddenly explode or wait times go crazy, you can actually do something about it. Pull someone back from lunch early, move calls around - whatever. I learned this the hard way after too many "why didn't anyone tell me?" moments. Set up alerts for your important metrics though, because nobody wants to babysit dashboards all day. It's basically like having superpowers for your operations.
CSAT is honestly the one metric that matters most - everything else is just noise if your customers hate you. You can crush your call times and resolution rates, but angry customers will still leave. It's like cooking a meal super fast but it tastes awful, right? Track it next to your other KPIs because there's always this weird tension between speed and satisfaction. Sometimes agents rush calls to hit their numbers and totally miss what the customer actually needs. I've seen teams obsess over efficiency metrics while their CSAT tanks. Don't be those guys.
So your KPI dashboard basically shows you all the historical call patterns - like when things get crazy busy during holidays or after you launch something new. Way better than digging through endless spreadsheets, trust me on that one. You'll spot those seasonal spikes and figure out your peak hours pretty quickly. Most of them have predictive features too that'll suggest future call volumes based on what happened before. Super helpful for staffing so you don't end up with customers sitting on hold forever. Just remember to factor in any marketing campaigns or launches that usually drive volume up.
So for your call center dashboard - make those critical numbers HUGE. Average wait time, service level, all that stuff needs to pop immediately. Line graphs are perfect for showing call volume throughout the day, and definitely go with the red/yellow/green thing because managers love that instant "oh shit" moment when something's wrong. I'd keep agent performance separate though, maybe in a click-through view? The main screen should scream "here's how we're doing RIGHT NOW" in like 5 seconds max. Trust me, cramming everything together just makes it useless - I've seen so many dashboards that look impressive but tell you nothing.
Honestly, real-time updates are where it's at if you can swing it. Every 15-30 minutes during busy periods works too. Daily updates? Pretty much pointless when you're dealing with angry customers and need to shuffle agents around. Real-time dashboards for stuff like handle time and queue length let you actually fix problems instead of just reading about them later. I mean, what's the point of knowing your hold times sucked yesterday when customers are hanging up today, right? Weekly/monthly is fine for the boring trend reports your boss wants. Start with hourly if real-time seems crazy, then level up from there.
Look, AHT basically controls how many calls your agents can knock out each hour. Longer calls = fewer customers helped and everyone else stuck waiting longer. When AHT starts climbing, you'll watch queue times explode and satisfaction tank. But here's what's tricky - sometimes those longer calls actually fix things right the first time, which honestly saves you headaches later. You're hunting for that balance where agents solve stuff efficiently but aren't rushing people off the phone like jerks. I'd definitely track first call resolution alongside AHT so you're not just optimizing for speed.
So basically, KPI dashboards track stuff like how long calls take, first-call resolution rates, and satisfaction scores. You'll start noticing patterns pretty fast - like Sarah always has 20-minute calls while everyone else wraps up in 10. It's like getting a real-time report card, honestly. The cool part? You can pinpoint exactly what people need help with instead of doing those boring company-wide training sessions that nobody pays attention to anyway. Maybe someone's great with customers but doesn't know the new software. Target that specific gap and you're golden.
For call center stuff? Focus on First Call Resolution, Average Handle Time, Customer Satisfaction, and Quality Assurance scores from monitoring calls. FCR shows if your agents actually fix things instead of playing hot potato with customers - which honestly drives me insane when I'm the one calling. AHT tracks efficiency without rushing people off the phone. CSAT gives you what customers really think. Those four will tell you who's killing it and who needs help. Oh, and don't obsess over AHT alone - some complex issues just take time.
Honestly, just throw all your main metrics into one dashboard - handle times, first-call resolution, customer satisfaction scores. Way better than jumping between a million different reports (which is honestly such a pain). Real-time updates let you see who's crushing it and who might need some extra help. Short sentences hit different sometimes. Your team can track their own numbers too, which I've found works really well since people like seeing their progress. Spotting trends becomes super easy when everything's in one place, and you can actually celebrate the wins instead of always hunting for problems.
So AI analytics totally transforms your KPI dashboards by catching patterns you'd miss otherwise. Real-time insights on agent performance, customer sentiment, predictive stuff - it's pretty wild. The best feature? Auto-flagging weird spikes like call abandonment rates going crazy or first-call resolution tanking. Honestly saves your team tons of manual work each week. Oh, and it can predict issues before they become actual fires, which is huge. I'd roll out sentiment analysis first though - gives you instant reads on customer satisfaction trends that you can actually act on right away.
Yeah, so there's definitely a solid connection between how engaged your agents are and pretty much all your main call center numbers. Higher engagement usually means better customer sat scores, more first-call resolutions, and faster handle times. Your turnover drops too - which honestly saves you a ton since hiring and training new people gets expensive fast. It actually works in reverse as well; when agents watch their performance improve, they get more motivated because they feel like they're actually good at their job. I'd track engagement metrics right alongside your operational stuff so you can catch problems early before everything goes sideways.
Ok so first thing - dig into your dashboard and look for patterns in what's making people unhappy. Wait times and agent stuff are usually the culprits. Break down your scores by different touchpoints to see where you're bleeding the most. Train your team on whatever keeps coming up as problems. Set up alerts so you catch NPS drops right when they happen instead of finding out later. Oh and don't just track the number - actually do something with it. Weekly reviews where you assign specific fixes work way better than just watching scores go up and down.
So basically, you get to see patterns you'd totally miss otherwise. Like when call volumes always spike (usually the same times) or which problems keep coming back - honestly it's always like 3 issues on repeat. You'll spot who on your team handles busy periods well and who doesn't. The seasonal stuff becomes super obvious too. Instead of just winging your schedules and hoping for the best, you can actually plan based on real data. Plus you figure out which training actually works. Way better than just guessing what'll happen next month.
Real-time dashboards are clutch - check out Tableau or Power BI for the visual stuff. Salesforce and HubSpot integrate pretty seamlessly if you need CRM data flowing in. Speech analytics tools can automatically track sentiment which is honestly way cooler than it sounds. AWS or Azure handle the backend scaling when things get crazy busy. Oh, and you'll definitely want API connectors for your phone system. Just don't go nuts trying to connect everything at once - learned that the hard way. Pick one integration, get it working, then add more.
-
Awesome presentation, really professional and easy to edit.
-
Thanks for all your great templates they have saved me lots of time and accelerate my presentations. Great product, keep them up!