

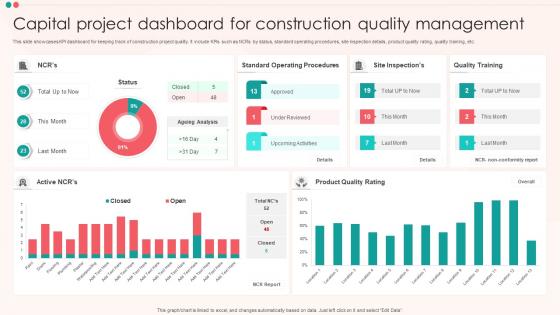
Capital Project Dashboard For Construction Quality Management




Try Before you Buy Download Free Sample Product
 Impress Your
 Audience
 100%
100% Editable
 Save Hours
 of Time


This slide showcases KPI dashboard for keeping track of construction project quality. It include KPIs such as NCRs by status, standard operating procedures, site inspection details, product quality rating, quality training, etc.
People who downloaded this PowerPoint presentation also viewed the following :
Capital Project Dashboard For Construction Quality Management with all 7 slides:
Use our Capital Project Dashboard For Construction Quality Management to effectively help you save your valuable time. They are readymade to fit into any presentation structure.





FAQs for Capital Project Dashboard For
**INPUT**: What are the key performance indicators (KPIs) commonly tracked in a capital project dashboard? **OUTPUT**: Capital project dashboards commonly track budget variance, schedule performance, resource utilization, milestone completion rates, and risk assessment metrics. These KPIs enable project managers to streamline decision-making by identifying cost overruns, timeline delays, and resource bottlenecks early, with many organizations finding that integrated dashboard monitoring ultimately delivers improved project outcomes and enhanced stakeholder transparency.
A capital project dashboard enhances decision-making by providing real-time visibility into budget performance, timeline adherence, resource allocation, and risk indicators across multiple projects simultaneously. This centralized approach enables project managers to identify bottlenecks early, reallocate resources strategically, and make data-driven adjustments, ultimately delivering improved project outcomes and organizational efficiency.
Real-time data serves as the foundation for effective capital project dashboards, enabling instant visibility into project progress, budget utilization, resource allocation, and risk indicators. This immediate access allows project managers and stakeholders to make informed decisions quickly, identify potential issues before they escalate, and maintain better control over timelines and costs, ultimately delivering improved project outcomes and enhanced organizational efficiency.
Visualizations within capital project dashboards improve stakeholder communication by transforming complex data into intuitive charts, graphs, and progress indicators that enable quick comprehension across diverse audiences. Through interactive elements like milestone tracking and budget variance displays, project managers streamline reporting processes while stakeholders gain real-time insights into project health, ultimately reducing meeting times and enhancing decision-making efficiency.
Critical components include real-time budget tracking, milestone progress indicators, resource allocation displays, risk assessment metrics, and stakeholder communication tools. These elements work together by providing comprehensive visibility into project health, enabling proactive decision-making, and streamlining reporting processes, with many organizations finding that integrated dashboards significantly reduce project delays and cost overruns.
Predictive analytics integrates into capital project dashboards through machine learning algorithms, real-time data feeds, risk modeling tools, and automated forecasting systems. These technologies enable project managers to anticipate budget overruns, schedule delays, and resource constraints before they occur, while delivering enhanced decision-making capabilities and improved project outcomes across construction, infrastructure, and manufacturing initiatives.
Organizations face challenges including data integration from multiple systems, ensuring real-time accuracy, securing stakeholder buy-in across departments, and managing change resistance from traditional reporting methods. While initial setup requires significant resource allocation and training, many companies find that streamlined visibility, enhanced decision-making capabilities, and improved project accountability ultimately deliver substantial operational efficiency and competitive advantage.
A capital project dashboard facilitates resource allocation by providing real-time visibility into budget utilization, timeline progress, resource availability, and project priorities across multiple initiatives simultaneously. This centralized view enables project managers to identify bottlenecks, redistribute personnel and materials strategically, and make data-driven allocation decisions, ultimately optimizing resource efficiency and preventing costly overruns.
A capital project dashboard supports risk management by providing real-time visibility into budget variances, schedule delays, resource constraints, and performance metrics across all project phases. Through automated alerts and predictive analytics, project managers can identify potential issues early, implement mitigation strategies proactively, and maintain stakeholder alignment, ultimately reducing project failures and cost overruns.
**INPUT**: What types of software or tools are best suited for creating a capital project dashboard? **OUTPUT**: Effective capital project dashboard tools include Microsoft Power BI, Tableau, Smartsheet, Oracle Primavera, and SAP Portfolio Management, each offering robust project tracking capabilities. These platforms streamline budget monitoring, timeline visualization, and resource allocation across multiple projects, with many construction firms and manufacturing organizations finding that integrated dashboards ultimately deliver enhanced visibility and faster decision-making. [Word count: 58 words]
Stakeholders can customize capital project dashboards through role-based filters, personalized widgets, drill-down capabilities, and configurable alert systems that highlight relevant metrics like budget variance, timeline progress, or resource allocation. These customization features enable executives to focus on high-level ROI while project managers track detailed milestones, ultimately delivering targeted insights that enhance decision-making efficiency across all organizational levels.
A well-structured capital project dashboard significantly enhances budgeting accuracy by providing real-time expense tracking, variance analysis, automated cost projections, and predictive forecasting capabilities. These features enable project managers to identify budget deviations early, adjust resource allocation proactively, and maintain financial control, with many organizations finding that dashboard-driven budgeting reduces cost overruns by 15-25% while improving stakeholder confidence.
AI and machine learning will revolutionize capital project dashboards by enabling predictive analytics, automated risk detection, real-time resource optimization, and intelligent scheduling adjustments. These technologies streamline project oversight by identifying potential delays before they occur, optimizing budget allocations dynamically, and delivering enhanced decision-making capabilities, with many organizations finding significantly improved project success rates and cost efficiency.
Best practices for maintaining data integrity within capital project dashboards include establishing standardized data entry protocols, implementing automated validation rules, conducting regular audit cycles, maintaining clear data governance frameworks, and ensuring real-time synchronization across systems. These approaches streamline accuracy by eliminating manual errors, enhancing transparency through consistent reporting standards, and enabling automated alerts for anomalies, ultimately delivering reliable project insights and improved decision-making capabilities.
User feedback can be effectively incorporated through regular surveys, usage analytics monitoring, stakeholder interviews, and iterative design sessions with project teams. Organizations like construction firms and manufacturing companies increasingly establish feedback loops through beta testing groups, quarterly review cycles, and direct integration requests, ultimately delivering dashboards that evolve with user needs while maintaining strategic project oversight capabilities.
-
I have been using SlideTeam for the past six months. Very happy and satisfied!
-
Nothing beats the well-formatted and professionally designed templates offered. Kudos to SlideTeam for their amazing collection of PPT slides.