

Chart meter on excel





Try Before you Buy Download Free Sample Product
 Impress Your
Audience
 100%
Editable
 Save Hours
of Time


Our Chart Meter On Excel are explicit and effective. They combine clarity and concise expression.
People who downloaded this PowerPoint presentation also viewed the following :
Chart meter on excel with all 2 slides:
Give your audience a fulfilling experience. They will find our Chart Meter On Excel elevating.

FAQs for Chart
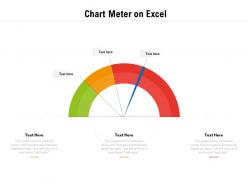
A chart meter in Excel is a specialized visualization that displays single metrics as gauge-style indicators, resembling speedometers or thermometers to show progress toward targets or thresholds. Unlike traditional charts that compare multiple data points across categories or time, chart meters focus on individual KPIs, enabling managers and analysts to quickly assess performance status, goal achievement, and operational efficiency at a glance, ultimately streamlining dashboard reporting.
Chart meters in Excel provide immediate visual clarity, space efficiency, progress tracking capabilities, customizable threshold indicators, and enhanced professional presentation quality. These visualization tools streamline data interpretation by displaying key metrics at a glance, enabling faster decision-making in financial dashboards, performance reviews, and project management scenarios, ultimately delivering clearer insights and more impactful business presentations.
You can customize chart meter appearance by modifying colors, fonts, data labels, and formatting through Excel's Chart Design and Format tabs, adjusting borders, fill colors, and text styles. By selecting complementary color schemes, consistent typography, and appropriate sizing that matches your presentation's visual identity, you ultimately create professional, cohesive charts that enhance audience engagement and strengthen your overall message delivery.
Chart meters in Excel work best with single-value metrics like KPIs, performance indicators, completion rates, satisfaction scores, and budget utilization percentages. These gauges effectively display data that has defined ranges or targets, such as sales performance against quotas, project completion status, or quality metrics in manufacturing, enabling managers to quickly assess performance levels and make data-driven decisions.
Yes, Excel chart meters can be linked to dynamic data sources through named ranges, Excel tables, or direct cell references that automatically update. By using dynamic named ranges with OFFSET or INDEX functions, or connecting meters to Excel table columns, organizations can create real-time dashboards for KPI monitoring, sales tracking, and performance metrics that refresh automatically as underlying data changes.
Creating a chart meter in Excel involves building a combination chart using doughnut and pie charts, setting up your data with actual values, maximum ranges, and remaining portions. You'll format the chart by removing unnecessary elements, adjusting colors to create the meter appearance, and adding data labels for clear value display, ultimately delivering professional dashboard visualizations that enhance data presentation and business reporting effectiveness.
**INPUT**: Are there specific Excel functions or features that enhance the functionality of chart meters? **OUTPUT**: Excel functions like SUMIF, VLOOKUP, OFFSET, and conditional formatting significantly enhance chart meter functionality by automating data updates, creating dynamic ranges, and visual indicators. These features enable organizations to streamline performance tracking, minimize manual updates, and deliver real-time dashboards, with many businesses finding that integrated meters ultimately provide clearer insights and faster decision-making capabilities. [Word count: 58 words]
Common mistakes include using inappropriate data ranges, selecting poor color schemes that reduce readability, overcrowding with excessive labels, choosing incorrect chart types for the data being measured, and failing to maintain consistent scaling intervals. These design flaws significantly compromise data visualization effectiveness, with many organizations finding that streamlined, well-scaled chart meters enhance decision-making accuracy and stakeholder comprehension across financial reporting and performance tracking initiatives.
Chart meters can be effectively used in business presentations to display KPI performance, sales targets, budget utilization, project completion rates, and customer satisfaction scores. These visual tools excel in executive dashboards, quarterly reviews, and status meetings where stakeholders need immediate understanding of progress against goals, with many organizations finding that meter charts streamline data interpretation and accelerate decision-making processes.
**INPUT**: How do I ensure that my chart meter accurately represents the data it's visualizing? **OUTPUT**: Ensuring chart meter accuracy requires setting appropriate scale ranges, validating data sources, and configuring proper minimum and maximum values that reflect your dataset's true scope. Through careful axis calibration and regular data verification, organizations can create reliable visual representations that support informed decision-making, with many finding that consistent formatting standards ultimately enhance presentation credibility and stakeholder trust. [Word count: 58 words]
Excel offers limited built-in chart meter templates, primarily through gauge charts in newer versions, combination charts, and doughnut charts with custom formatting. However, many organizations find that pre-designed PowerPoint templates from platforms like SlideTeam deliver more professional, customizable meter designs, ultimately enabling faster dashboard creation and enhanced data visualization for executive presentations.
Excel chart meters can incorporate color gradients through conditional formatting, data bars with gradient fills, and custom formatting options that blend multiple colors seamlessly across value ranges. These gradient techniques enhance data visualization by creating intuitive visual flows, improving stakeholder comprehension during presentations, and delivering more engaging dashboard experiences, with many organizations finding that gradient-enhanced meters significantly increase audience retention and decision-making speed.
Data labels in chart meters display precise values, percentages, or performance indicators directly on the visualization, eliminating guesswork and enhancing data interpretation accuracy. They can be optimized through strategic positioning, consistent formatting, selective display of key metrics, and dynamic conditional formatting, with many organizations finding that well-designed labels significantly improve dashboard readability and decision-making speed.
Excel's built-in animation options for chart meters are limited, but you can create dynamic effects by manually updating data during presentations or using VBA macros for automated transitions. While PowerPoint offers more robust animation capabilities for imported Excel charts, many presenters find that strategic data reveals and progressive chart updates in Excel deliver engaging visual storytelling and enhanced audience engagement.
Excel offers several alternatives to chart meters including gauge charts, bullet charts, thermometer charts, progress bars, and conditional formatting with data bars. These visualization methods enhance data presentation by providing clear performance indicators, comparative analysis capabilities, and intuitive visual feedback, with many organizations finding that combining multiple chart types delivers more comprehensive dashboards and improved stakeholder understanding.
No Reviews