

Circle donut chart with percentage graph powerpoint slides





Try Before you Buy Download Free Sample Product
 Impress Your
Audience
 100%
Editable
 Save Hours
of Time


Growth is a given with our Circle Donut Chart With Percentage Graph Powerpoint Slides. You can assume it to be a fact.
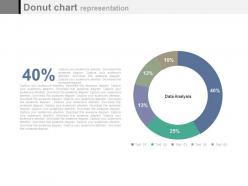
Presenting circle donut chart with percentage graph powerpoint slides. This Power Point template slide has been crafted with graphic of circle donut chart and percentage graph .This PPT slide contains the concept of financial analysis. Use this PPT slide for business and finance related presentations.
People who downloaded this PowerPoint presentation also viewed the following :
Circle donut chart with percentage graph powerpoint slides with all 4 slides:
Our Circle Donut Chart With Percentage Graph Powerpoint Slides curb any harassment. They help counter contradictions.

Most Relevant Reviews
-
Content of slide is easy to understand and edit.
-
Use of icon with content is very relateable, informative and appealing.