


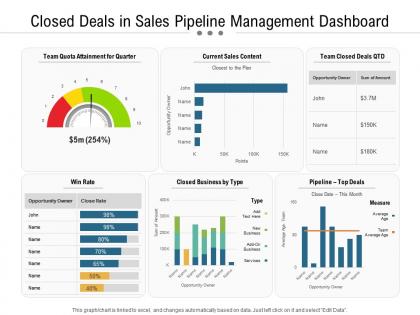
Closed deals in sales pipeline management dashboard




Try Before you Buy Download Free Sample Product
 Impress Your
 Audience
 100%
100% Editable
 Save Hours
 of Time


Our Closed Deals In Sales Pipeline Management Dashboard are topically designed to provide an attractive backdrop to any subject. Use them to look like a presentation pro.
People who downloaded this PowerPoint presentation also viewed the following :
Closed deals in sales pipeline management dashboard with all 2 slides:
Use our Closed Deals In Sales Pipeline Management Dashboard to effectively help you save your valuable time. They are readymade to fit into any presentation structure.

FAQs for Closed deals in sales
Key elements include deal overview with client details and timeline, problem-solution narrative, quantifiable results and ROI metrics, testimonials or client feedback, and visual data representations like charts or graphs. These components work together to demonstrate proven success patterns, build credibility with prospective clients, and showcase your organization's track record of delivering measurable outcomes across various business scenarios.
Visual storytelling enhances closed deal presentations by transforming complex data into compelling narratives through infographics, progress timelines, client testimonials, and success metrics that resonate emotionally with stakeholders. These visual elements streamline communication, build credibility, and demonstrate tangible value, with many sales teams finding that strategic visual narratives accelerate decision-making and ultimately secure more profitable deals.
**INPUT**: What types of data visualizations are most effective for illustrating sales performance in closed deals? **OUTPUT**: Effective visualizations for closed deals include conversion funnels, timeline charts, heat maps, comparative bar charts, and trend line graphs. These tools enhance sales analysis by revealing conversion patterns, identifying top-performing periods, and showcasing team achievements, with many organizations finding that visual dashboards streamline reporting and accelerate strategic decision-making processes.
Presentation templates can be tailored by incorporating industry-specific metrics, terminology, regulatory considerations, and visual elements that resonate with sector audiences. Financial services presentations might emphasize ROI and compliance outcomes, while healthcare focuses on patient impact metrics, and manufacturing highlights operational efficiency gains, with many organizations finding that customized templates significantly enhance stakeholder engagement and deal credibility.
Case studies demonstrate proven results, build credibility, and provide concrete evidence of value delivery through detailed closed deal narratives, client testimonials, and measurable outcomes. These strategic presentations enable sales teams to showcase their track record across industries like healthcare, finance, and manufacturing, ultimately reducing prospect concerns, accelerating decision-making, and increasing conversion rates.
Visual dashboards with key metrics work best for executives, while detailed case studies with ROI breakdowns suit clients, and team presentations should include process insights and lessons learned. These formats enhance stakeholder engagement by delivering relevant information tailored to each audience's priorities, with many organizations finding that customized presentations significantly improve communication effectiveness and strategic decision-making.
Presentation templates help streamline closed deal reporting by standardizing data visualization, ensuring consistent formatting across teams, and reducing preparation time for stakeholder presentations. These templates enable sales organizations to quickly showcase deal metrics, revenue outcomes, and performance trends, while maintaining professional consistency and allowing teams to focus on analysis rather than design, ultimately delivering faster reporting cycles.
Common mistakes include overwhelming audiences with excessive data, failing to highlight key success factors, presenting deals in isolation without strategic context, and neglecting to extract actionable insights for future opportunities. While comprehensive deal summaries provide valuable transparency, many organizations find that focusing on replicable strategies, clear ROI demonstrations, and lessons learned delivers greater strategic value than exhaustive transaction details, ultimately enabling teams to accelerate future deal closure rates.
Testimonials enhance closed deals presentations by incorporating client quotes, success metrics, case study highlights, and quantifiable outcomes directly into template slides. These authentic endorsements build credibility through specific results like revenue increases or efficiency gains, with many sales teams finding that prospect-facing testimonials accelerate decision-making and reinforce trust during critical closing conversations.
Design elements that enhance closed deals presentations include compelling data visualizations, before-and-after comparisons, client testimonials with photos, interactive timeline graphics, and strategic use of brand colors to highlight successes. These visual approaches streamline complex sales data by creating emotional connections, reinforcing credibility, and demonstrating measurable outcomes, ultimately delivering more persuasive presentations that resonate with stakeholders.
A presentation template facilitates closed deal comparisons by standardizing metrics like deal value, timeline, customer segments, and success factors across multiple transactions. This structured approach enables sales teams to identify winning patterns, benchmark performance variations, and extract actionable insights, with many organizations finding that consistent formatting accelerates strategic decision-making and improves future deal closure rates.
Best practices for incorporating charts and graphs in closed deals presentations include using revenue trend lines, deal size distributions, conversion funnel visualizations, timeline comparisons, and client segment breakdowns. These visual elements streamline complex sales data by highlighting growth patterns, identifying top-performing sectors, and demonstrating conversion efficiency, ultimately enabling sales teams and stakeholders to make strategic decisions faster while showcasing measurable business outcomes.
Templates enable sales teams to present future opportunities from closed deals by standardizing success stories, showcasing expansion potential, demonstrating ROI metrics, and mapping relationship networks from previous wins. These structured presentations help organizations communicate value propositions more effectively, identify cross-selling opportunities, and leverage proven results to secure additional business, ultimately accelerating revenue growth.
Design presentation templates with modular slide structures, customizable data visualization sections, interchangeable case study placeholders, and adaptable messaging frameworks that accommodate different deal types and client industries. This approach enables sales teams to quickly customize content for specific scenarios, whether presenting acquisition deals, partnership agreements, or service contracts, while maintaining brand consistency and professional polish across all closed deal presentations.
Persuasive techniques for closed deal presentations include social proof through testimonials, quantified ROI metrics, competitive differentiation analysis, risk mitigation frameworks, and strategic timeline visualization. These approaches enhance credibility by showcasing measurable outcomes, addressing stakeholder concerns, and demonstrating competitive advantage, with many organizations finding that structured value reinforcement accelerates decision-making and strengthens long-term client relationships.
-
Unique design & color.
-
Informative presentations that are easily editable.
-
The Designed Graphic are very professional and classic.
-
Qualitative and comprehensive slides.
-
Understandable and informative presentation.