


Cloud Infrastructure Performance Management KPI Dashboard





Try Before you Buy Download Free Sample Product
 Impress Your
Audience
 100%
Editable
 Save Hours
of Time


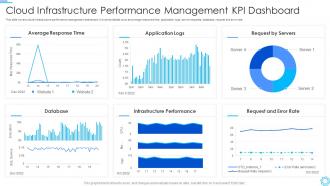
This slide covers cloud infrastructure performance management dashboard. It involves details such as average response time, application logs, server requests, database, request and error rate.
People who downloaded this PowerPoint presentation also viewed the following :
Cloud Infrastructure Performance Management KPI Dashboard with all 7 slides:
Use our Cloud Infrastructure Performance Management KPI Dashboard to effectively help you save your valuable time. They are readymade to fit into any presentation structure.






FAQs for Cloud Infrastructure Performance
Critical Cloud Infrastructure Performance Management KPIs include response time, throughput, resource utilization, availability uptime, and error rates across distributed systems. These metrics enable organizations to streamline operations by identifying bottlenecks, optimizing resource allocation, and maintaining service quality, with many enterprises finding that comprehensive monitoring ultimately delivers enhanced customer experiences and significant cost reductions.
Latency metrics directly impact user experience by affecting application responsiveness, page load times, transaction processing speeds, and real-time feature functionality. Higher latency creates user frustration, abandoned sessions, and reduced engagement, while optimized latency enhances satisfaction and retention, with many e-commerce and financial services organizations finding that even millisecond improvements significantly boost conversion rates and competitive advantage.
Resource utilization serves as a fundamental KPI for cloud infrastructure performance, measuring CPU, memory, storage, and network usage across distributed systems. Effective utilization monitoring enables organizations to optimize costs, prevent bottlenecks, and ensure scalable operations, with many enterprises finding that balanced resource allocation ultimately delivers enhanced application performance and strategic competitive advantage.
**INPUT**: Which KPIs should be prioritized for assessing the reliability of cloud services? **OUTPUT**: Priority KPIs for cloud service reliability include uptime percentage, mean time to recovery, error rates, response times, and availability metrics across multiple regions. These indicators enable organizations to monitor service continuity, identify potential issues proactively, and maintain consistent user experiences, with many enterprises finding that comprehensive KPI tracking ultimately delivers improved operational efficiency and competitive advantage.
Cost efficiency in cloud performance management is measured through resource utilization rates, cost per transaction, right-sizing accuracy, and automated scaling effectiveness. Through comprehensive monitoring, organizations streamline expenses by eliminating idle resources, optimizing instance types, and implementing predictive scaling, with many enterprises finding that strategic performance tracking reduces cloud costs by 20-40% while maintaining service quality.
Uptime percentages directly measure cloud infrastructure reliability and availability, with 99.9% uptime allowing only 8.77 hours of downtime annually while 99.99% permits just 52 minutes. These metrics significantly impact business operations, customer satisfaction, and revenue generation, with many enterprises finding that higher uptime percentages reduce operational risks, enhance user experiences, and deliver competitive advantages in increasingly digital markets.
Organizations balance performance KPIs with security measures through integrated monitoring platforms, automated compliance frameworks, and risk-based security controls that maintain operational efficiency. By implementing DevSecOps practices, real-time threat detection, and performance-aware security protocols, companies in sectors like financial services and healthcare achieve both robust protection and optimal system performance, ultimately delivering secure, high-performing cloud environments.
Effective cloud performance KPI tracking platforms include AWS CloudWatch, Azure Monitor, Google Cloud Operations Suite, New Relic, and Datadog. These tools streamline monitoring by providing real-time analytics, automated alerting, and comprehensive dashboards, with many organizations finding that integrated solutions deliver enhanced visibility, faster issue resolution, and ultimately improved operational efficiency across their cloud infrastructure.
Cloud performance KPIs should be reviewed monthly for strategic alignment, weekly for operational metrics, and daily for critical system health indicators. This tiered approach enables organizations to maintain agility while ensuring infrastructure supports evolving business objectives, with many enterprises finding that regular review cycles enhance resource optimization, reduce costs, and deliver consistently reliable customer experiences.
Performance KPIs inform cloud resource scaling decisions by monitoring CPU utilization, memory consumption, response times, throughput rates, and error frequencies across applications. These metrics enable automated scaling triggers, predictive capacity planning, and cost optimization strategies, with many financial services and e-commerce platforms finding that data-driven scaling reduces operational costs while maintaining seamless customer experiences.
Application-specific performance metrics focus on user experience elements like response times, transaction success rates, and feature-specific availability, while general cloud infrastructure KPIs track underlying resource utilization, network latency, and system uptime. Banking applications monitor loan processing times and fraud detection accuracy, whereas infrastructure teams track CPU usage and storage performance, with many organizations finding that combining both perspectives delivers comprehensive visibility into service quality and operational efficiency.
Data transfer speed significantly impacts cloud infrastructure performance evaluation by affecting application responsiveness, user experience quality, and operational efficiency metrics. Slow transfer rates create bottlenecks in real-time applications, data synchronization processes, and backup operations, while optimized speeds enable faster deployment cycles, seamless multi-cloud integration, and enhanced customer satisfaction, ultimately delivering competitive advantage in increasingly data-driven business environments.
Companies can benchmark their cloud infrastructure KPIs against industry standards through third-party benchmarking services, cloud provider analytics tools, industry reports from organizations like Gartner, and peer networking through professional associations. These approaches enable organizations to compare metrics like uptime, response times, and cost efficiency against sector-specific baselines, while identifying optimization opportunities that deliver improved performance and competitive advantage.
Time-series analysis, statistical modeling, machine learning algorithms, comparative benchmarking, and automated anomaly detection enable comprehensive trend analysis in cloud performance metrics. These methods help organizations identify patterns, predict capacity needs, and optimize resource allocation by analyzing historical data across compute, storage, and network performance, ultimately delivering proactive infrastructure management and cost efficiency.
Organizations can leverage performance KPIs by establishing baseline measurements, monitoring resource utilization patterns, tracking application response times, and analyzing cost-per-workload metrics during migration phases. These strategic measurements enable businesses to identify optimal migration sequences, predict scaling requirements, and minimize service disruptions, with many enterprises finding that data-driven approaches reduce migration costs by 30-40% while ensuring seamless transitions.
-
The team is highly dedicated and professional. They deliver their work on time and with perfection.
-
Helpful product design for delivering presentation.