


Company financial performance summary dashboard presentation slides




Try Before you Buy Download Free Sample Product
 Impress Your
 Audience
 100%
100% Editable
 Save Hours
 of Time


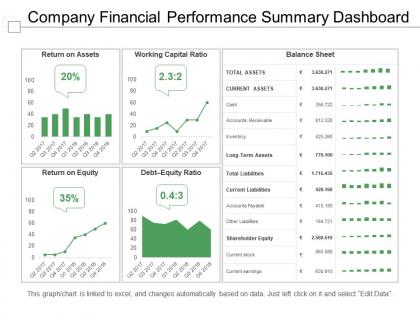
Represent the financial ability of your company with this professionally developed PPT image on the concept of company financial performance summary dashboard PPT slide. It will help in communicating your financial abilities in an effective manner. It will also works as an effective management information tool which is used by the company to represent your position. You can also use this financial performance PPT template to describe the use of your available assets or business resource. It allows your employees to know about the company abilities and which further motivates them to work with more efficiency. You can even represent the company profitability ratios, financial statement graphically through this ready to use business financial performance report PPT template. Use this company financial reporting PPT image to take better financial decisions on the basis of your company financial capability. Therefore, click on the download option given below to improve the financial prospects of your organization. Thus, use this professional business financial PPT template. Get off the blocks in an impressive fashion with our Company Financial Performance Summary Dashboard Presentation Slides. It helps inaugurate your endeavor.
People who downloaded this PowerPoint presentation also viewed the following :
Company financial performance summary dashboard presentation slides with all 5 slides:
Rise above the banal with our Company Financial Performance Summary Dashboard Presentation Slides. Project the inherent classiness of your thoughts.
FAQs for Company financial performance summary
Essential financial KPIs include revenue growth, profit margins, cash flow, return on investment, debt-to-equity ratios, and budget variance analysis. These metrics enable organizations to monitor operational efficiency, identify trends, and make strategic decisions, with many financial institutions and corporations finding that comprehensive dashboards ultimately streamline reporting while delivering enhanced visibility into performance drivers.
Visual representations enhance understanding in financial performance dashboards by transforming complex numerical data into intuitive charts, graphs, and heat maps that reveal patterns and trends instantly. These visual elements enable executives and financial teams to quickly identify performance gaps, revenue fluctuations, and cost anomalies, while facilitating faster decision-making and strategic adjustments across organizations.
Best practices for designing user-friendly financial performance dashboards include prioritizing key metrics, using intuitive visualizations, maintaining consistent layouts, implementing interactive filtering, and ensuring mobile responsiveness. These approaches streamline decision-making by presenting clear data hierarchies, reducing cognitive load, and enabling quick trend identification, with many financial institutions finding that well-designed dashboards enhance operational efficiency and strategic planning.
Financial performance dashboards should be updated daily for operational metrics, weekly for departmental summaries, monthly for comprehensive financial statements, and quarterly for strategic KPIs. Through automated data integration, organizations streamline reporting processes, minimize manual errors, and enhance decision-making accuracy, with many financial institutions finding that real-time updates deliver competitive advantage and improved regulatory compliance.
Financial performance dashboards are commonly created using tools like Tableau, Power BI, Excel, QuickSight, and Qlik Sense, along with specialized platforms such as SAP BusinessObjects and IBM Cognos. These technologies streamline financial reporting by automating data visualization, enabling real-time monitoring, and delivering comprehensive analytics, with many organizations finding that integrated dashboards significantly enhance decision-making speed and operational transparency.
A financial performance dashboard aids executive decision-making by consolidating real-time financial data, visualizing key performance indicators, tracking budget variances, and highlighting trends across departments and time periods. Through automated reporting and interactive analytics, executives can quickly identify operational inefficiencies, assess investment opportunities, and pivot strategies based on actual performance metrics, ultimately enabling faster, data-driven decisions that enhance competitive positioning.
Real-time data transforms financial performance dashboards by enabling immediate decision-making, accurate performance tracking, dynamic risk assessment, and rapid response to market changes. Through live data feeds, organizations streamline financial monitoring, enhance forecasting accuracy, and minimize operational delays, with many financial institutions finding that real-time insights ultimately deliver competitive advantage and improved strategic agility.
Companies ensure data integrity in financial dashboards through automated data validation, real-time synchronization with source systems, role-based access controls, and regular audit trails. These measures streamline accuracy by eliminating manual errors, detecting anomalies immediately, and maintaining compliance standards, with many financial institutions finding that integrated validation processes ultimately deliver more reliable reporting and enhanced regulatory confidence.
Financial performance dashboards support budgeting and forecasting by providing real-time data visualization, historical trend analysis, variance tracking, and predictive modeling capabilities. These tools enable finance teams to identify spending patterns, anticipate cash flow needs, and adjust forecasts dynamically, with many organizations finding that integrated dashboards streamline planning cycles while delivering more accurate predictions and strategic financial insights.
Interactive elements enhance financial performance dashboard engagement by enabling drill-down capabilities, real-time filtering, customizable views, and dynamic visualizations that allow users to explore data at their preferred depth. Through features like clickable charts, hover details, and personalized metric selections, finance teams can quickly identify trends, analyze variances, and generate actionable insights, ultimately delivering faster decision-making and improved financial oversight.
Key financial health metrics include revenue growth, profit margins, cash flow ratios, debt-to-equity ratios, and return on investment indicators. These metrics enable executives to monitor liquidity, profitability, and operational efficiency simultaneously, with many organizations finding that real-time dashboard visibility streamlines decision-making and enhances strategic planning capabilities.
Financial performance dashboards can be tailored by customizing metrics, visualization formats, and detail levels for each audience's specific needs and responsibilities. Executive dashboards emphasize high-level KPIs and strategic trends, while department managers receive operational metrics relevant to their areas, and analysts access granular data with advanced filtering capabilities, ultimately enabling more informed decision-making across organizational levels.
Organizations face challenges including data integration complexity, ensuring real-time accuracy, selecting relevant KPIs, user adoption resistance, and maintaining data security across multiple systems. These implementation hurdles often stem from fragmented financial systems and varying stakeholder requirements, with many companies finding that strategic planning and phased rollouts ultimately deliver improved visibility and faster decision-making capabilities.
Storytelling through data in financial performance dashboards involves creating logical narrative flows through sequential visualizations, contextual annotations, and progressive disclosure of insights that guide users from high-level trends to specific details. By incorporating comparative timelines, variance explanations, and predictive indicators, finance teams can transform raw metrics into compelling business narratives that clearly communicate performance drivers, identify opportunities, and support strategic decision-making across organizations.
Emerging trends in financial dashboarding include real-time data integration, AI-powered predictive analytics, mobile-first design, automated anomaly detection, and cloud-based platforms. These technologies enhance decision-making by delivering instant insights, streamlining financial reporting, and enabling remote accessibility, with many organizations finding that modern dashboards significantly reduce reporting time while improving strategic visibility and operational efficiency.
-
Qualitative and comprehensive slides.
-
Great experience, I would definitely use your services further.