

Comparative Balance Sheet Statement Of The Coaching Start Up Business Plan For Coaching Institute BP SS





Try Before you Buy Download Free Sample Product
 Impress Your
Audience
 100%
Editable
 Save Hours
of Time


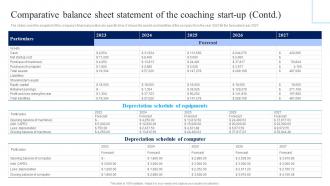
The slides cover the snapshot of the companys financial position at a specific time. It shows the assets and liabilities of the company from the year 2023 till the forecasted year 2027.
People who downloaded this PowerPoint presentation also viewed the following :
Comparative Balance Sheet Statement Of The Coaching Start Up Business Plan For Coaching Institute BP SS with all 11 slides:
Use our Comparative Balance Sheet Statement Of The Coaching Start Up Business Plan For Coaching Institute BP SS to effectively help you save your valuable time. They are readymade to fit into any presentation structure.








FAQs for Comparative Balance Sheet Statement Of The Coaching Start Up Business Plan For Coaching
The primary purpose of a comparative balance sheet is to enable financial analysts and stakeholders to identify trends, evaluate performance changes, and assess a company's financial stability over multiple periods through side-by-side comparison. This analysis streamlines decision-making by highlighting shifts in assets, liabilities, and equity, ultimately delivering enhanced insights for investment decisions and strategic planning.
A comparative balance sheet assists in tracking financial performance by revealing trends in assets, liabilities, and equity across multiple periods, enabling analysis of growth patterns, debt management, and capital structure changes. Through year-over-year comparisons, businesses can identify operational improvements, assess financial stability, and make strategic decisions about resource allocation, with many organizations finding that these insights ultimately enhance competitive positioning and investor confidence.
A comparative balance sheet includes assets (current assets like cash and inventory, fixed assets like property and equipment), liabilities (current and long-term debt obligations), and shareholders' equity across multiple periods. These components enable organizations to analyze financial trends, assess liquidity changes, and evaluate capital structure evolution, with many financial institutions and corporations finding that period-over-period comparisons deliver enhanced strategic insights and improved investment decision-making.
Comparative balance sheets help stakeholders assess liquidity by tracking current assets versus current liabilities over time, while solvency analysis examines debt-to-equity ratios and total debt trends across periods. Through year-over-year comparisons, investors and creditors can identify improving cash positions, declining leverage ratios, and strengthening financial stability, ultimately enabling more informed lending and investment decisions.
Comparative balance sheets offer enhanced analytical capabilities by displaying multiple periods side-by-side, enabling trend identification, variance analysis, and performance tracking over time. Financial analysts, investors, and management teams leverage these insights to identify growth patterns, assess liquidity changes, and evaluate asset utilization efficiency, ultimately delivering more informed strategic decisions and competitive advantage in financial planning.
Trends in comparative balance sheets inform strategic decisions by revealing liquidity patterns, debt management effectiveness, asset utilization changes, and profitability trajectories over multiple periods. These insights enable management to identify operational inefficiencies, optimize capital allocation, and adjust strategic priorities, with many organizations finding that consistent trend analysis ultimately delivers more informed investment decisions and enhanced competitive positioning.
Significant changes in comparative balance sheet line items require analyzing both absolute dollar amounts and percentage variations to identify operational shifts, strategic decisions, or market impacts. Focus on major asset acquisitions, debt restructuring, inventory fluctuations, or equity changes, with many financial analysts finding that trends exceeding 10-15% warrant deeper investigation into underlying business drivers and competitive positioning.
Comparative balance sheets enable investors and acquirers to assess target companies by revealing financial trends, asset quality changes, debt progression, and operational efficiency patterns over multiple periods. Through trend analysis of key ratios and balance sheet movements, potential buyers can identify growth trajectories, financial stability risks, and valuation opportunities, ultimately making more informed acquisition decisions with greater confidence in projected returns.
A comparative balance sheet reveals asset allocation shifts by displaying side-by-side figures from different periods, showing percentage changes in current assets, fixed assets, and investments. This analysis enables financial managers to identify strategic reallocations, track capital deployment efficiency, and assess whether shifts align with business objectives, ultimately delivering enhanced visibility into resource optimization and investment performance.
When discrepancies appear in comparative balance sheets, immediate measures include conducting detailed account reconciliations, reviewing journal entries and supporting documentation, verifying data entry accuracy, and implementing stronger internal controls. These corrective actions streamline financial reporting by identifying root causes, preventing future errors, and ensuring regulatory compliance, with many organizations finding that systematic discrepancy resolution ultimately enhances stakeholder confidence and operational transparency.
Industry benchmarking enhances comparative balance sheet analysis by providing external context for interpreting financial trends, ratios, and performance metrics against sector standards. While internal comparisons reveal company trajectory, benchmarking against industry peers enables organizations to identify competitive positioning, strategic opportunities, and areas requiring improvement, ultimately delivering deeper insights for strategic decision-making and operational optimization.
Common pitfalls include inconsistent accounting methods between periods, failing to adjust for significant one-time events, overlooking changes in accounting standards, and not considering seasonal variations or business cycles. Many financial analysts find that rushing through ratio calculations without understanding underlying business context, ignoring footnote disclosures, or comparing companies with different fiscal year-ends ultimately compromises analysis accuracy and strategic decision-making.
Technology enhances comparative balance sheet preparation through automated data integration, real-time financial reporting systems, cloud-based accounting platforms, and advanced analytics tools. These solutions streamline data collection, minimize manual errors, and enable instant period-to-period comparisons, with many financial teams finding that automated reconciliation and customizable reporting features significantly reduce preparation time while improving accuracy.
Startup comparative balance sheets typically show rapid asset growth, minimal retained earnings, higher cash burn rates, and significant equity fluctuations from funding rounds. Established companies demonstrate more stable asset bases, substantial retained earnings accumulation, predictable working capital patterns, and lower debt-to-equity ratios, with many investors finding that these differences reflect distinct growth phases and risk profiles.
Economic context significantly influences comparative balance sheet figures through altered asset valuations, changed liability structures, and modified equity positions reflecting market conditions. During recessions, organizations typically show decreased asset values, higher provisions for bad debts, and reduced retained earnings, while growth periods reveal increased investments, improved liquidity ratios, and enhanced shareholder equity, ultimately enabling stakeholders to assess financial resilience.
-
“The presentation template I got from you was a very useful one.My presentation went very well and the comments were positive.Thank you for the support. Kudos to the team!”
-
SlideTeam is the best in the business. Their templates are engaging and customizable. You can rely on them.