

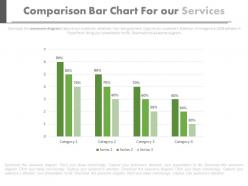
Comparision bar chart for our services powerpoint slides





Try Before you Buy Download Free Sample Product
 Impress Your
Audience
 100%
Editable
 Save Hours
of Time


Get the bargain you desired with our Comparision Bar Chart For Our Services Powerpoint Slides. You will extract an excellent deal.
People who downloaded this PowerPoint presentation also viewed the following :
Comparision bar chart for our services powerpoint slides with all 4 slides:
People don?t come to presentations to read or to listen to music that?s why you have to be careful when preparing presentations. To help you our Comparision Bar Chart For Our Services Powerpoint Slides have been pre-prepared and all you have to do is to fill in the needed information.


FAQs for Comparision bar chart for our
Comparison bar charts offer immediate visual clarity for categorical data differences, precise value comparisons through length positioning, universal interpretability across audiences, and flexible orientation options for various data sets. These charts streamline decision-making by enabling quick identification of performance gaps, market positions, and competitive advantages, with many organizations finding that bar charts accelerate stakeholder comprehension and strategic discussions.
Effective color schemes for comparison bar charts rely on high contrast combinations, consistent categorical colors, and accessibility-friendly palettes that distinguish data series clearly. Strategic color choices enhance readability by using complementary hues for different categories, maintaining sufficient brightness contrast, and incorporating colorblind-friendly options, ultimately delivering improved data comprehension and audience engagement across presentations.
Common mistakes include using inconsistent scales, overcrowding with too many categories, poor color choices that confuse rather than clarify, unclear labeling, and starting bars at non-zero baselines. These design flaws undermine data accuracy and audience comprehension, with many presenters finding that clean formatting, strategic color coding, and proper scaling significantly enhance message clarity and decision-making effectiveness.
Comparison bar charts highlight temporal trends by displaying data across multiple time periods, enabling viewers to identify growth patterns, seasonal fluctuations, cyclical behaviors, and performance trajectories. These visualizations streamline trend analysis by grouping related metrics chronologically, with many organizations finding that this approach enhances strategic planning, reveals market opportunities, and ultimately delivers clearer insights for data-driven decision making.
**INPUT**: What tools or software are recommended for creating high-quality comparison bar charts? **OUTPUT**: Recommended tools include Microsoft Excel, Tableau, Power BI, Google Charts, and specialized presentation software like SlideTeam templates. These platforms streamline chart creation by offering customizable templates, automated data integration, and professional formatting options, with many organizations finding that dedicated visualization tools ultimately deliver more polished presentations and enhanced stakeholder engagement. [Word count: 54 words]
Axis scaling dramatically influences comparison bar chart interpretation by affecting visual proportions, emphasizing differences, and potentially misleading viewers through truncated or exaggerated scales. Strategic scaling choices enable clearer data storytelling, with financial analysts, market researchers, and business executives finding that consistent baseline scaling enhances accuracy while proportional scaling highlights meaningful variations, ultimately delivering more credible insights.
Labels and annotations enhance comparison bar chart clarity by providing precise data values, category descriptions, and contextual information that eliminates guesswork for viewers. These elements streamline data interpretation by highlighting key differences, explaining outliers, and adding relevant benchmarks or targets, with many organizations finding that well-annotated charts significantly improve decision-making speed and accuracy across presentations.
The number of categories significantly influences comprehension, with 5-7 categories typically maximizing clarity while avoiding cognitive overload that occurs with excessive options. Too few categories may oversimplify complex data relationships, while too many can overwhelm audiences and dilute key insights, with many analysts finding that strategic category grouping enhances decision-making speed and accuracy.
**INPUT**: What type of data is most suitable for representation through comparison bar charts? **OUTPUT**: Comparison bar charts work best with categorical data that requires side-by-side analysis, including sales performance across regions, revenue comparisons between product lines, survey responses by demographics, and performance metrics across time periods. These visualizations enable organizations to identify trends, highlight disparities, and make data-driven decisions quickly, with many businesses finding that comparative presentations streamline stakeholder discussions and accelerate strategic planning processes.
Audience demographics significantly influence comparison bar chart design through color accessibility considerations, cultural reading patterns, technical literacy levels, and visual complexity preferences. Professional audiences may prefer detailed multi-series comparisons with subdued colors, while consumer-focused presentations benefit from simplified designs and high-contrast palettes, ultimately ensuring data comprehension aligns with viewer expectations and capabilities.
Best practices for integrating comparison bar charts into interactive presentations include using clear labels, consistent color coding, animated data reveals, clickable segments for detailed breakdowns, and responsive design elements. These approaches enhance audience engagement by enabling real-time data exploration, facilitating deeper insights through hover effects and drill-down capabilities, and ultimately delivering more compelling storytelling with improved comprehension and retention.
Comparison bar charts adapt for mobile viewing through responsive design, simplified color schemes, interactive tooltips, and strategic data grouping or filtering options. These digital optimizations enhance readability on smaller screens while maintaining visual impact, with many organizations finding that mobile-optimized charts actually improve user engagement and decision-making speed across devices.
Storytelling principles enhance comparison bar charts by creating narrative flow through strategic ordering, highlighting key differences with compelling titles, and guiding viewers through logical data progression. These techniques transform static comparisons into engaging visual stories, with many organizations finding that narrative-driven charts improve stakeholder comprehension, accelerate decision-making processes, and ultimately deliver more persuasive presentations.
Strategies to simplify complex data in comparison bar charts include grouping related categories, using color coding for clarity, limiting the number of variables displayed, and implementing consistent scaling across axes. These approaches streamline data visualization by reducing cognitive load, enhancing pattern recognition, and improving audience comprehension, with many organizations finding that simplified charts deliver faster decision-making and more effective stakeholder communication.
Ensuring alignment requires defining clear presentation objectives, selecting relevant data categories that support key messages, and using consistent visual elements like colors and labels that reinforce your brand narrative. Strategic chart design involves emphasizing the most important comparisons through visual hierarchy, maintaining data accuracy, and positioning the chart within your presentation flow to build toward actionable conclusions, ultimately delivering compelling evidence that drives decision-making and stakeholder engagement.
-
Out of the box and creative design.
-
Great designs, really helpful.