

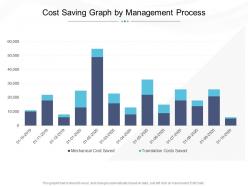
Cost saving graph by management process





Try Before you Buy Download Free Sample Product
 Impress Your
Audience
 100%
Editable
 Save Hours
of Time


Our Cost Saving Graph By Management Process are topically designed to provide an attractive backdrop to any subject. Use them to look like a presentation pro.
People who downloaded this PowerPoint presentation also viewed the following :
Cost saving graph by management process with all 2 slides:
Use our Cost Saving Graph By Management Process to effectively help you save your valuable time. They are readymade to fit into any presentation structure.

FAQs for Cost saving graph
Key factors contributing to cost efficiency include automation technologies, strategic resource allocation, supply chain optimization, energy management systems, and streamlined operational processes. These approaches enhance profitability by reducing overhead expenses, minimizing waste, and maximizing productivity, with many organizations finding that systematic cost control ultimately delivers competitive advantage and sustainable growth.
Presentation templates streamline cost analysis reports by providing pre-designed frameworks with standardized charts, financial tables, and data visualization formats that eliminate repetitive design work. These templates enable finance teams to quickly populate sections with budget breakdowns, expense comparisons, and ROI calculations, ultimately reducing report preparation time by hours while ensuring consistent, professional formatting across all financial presentations.
Cost efficiency is most critically assessed through visual presentations in healthcare, manufacturing, financial services, construction, and energy sectors. These industries rely on detailed charts, dashboards, and infographics to communicate complex cost analyses to stakeholders, with many organizations finding that visual presentations streamline decision-making processes, enhance budget transparency, and ultimately deliver faster approvals for cost-reduction initiatives.
Effective cost efficiency metrics for visual display include cost-per-unit ratios, budget variance analysis, operational efficiency percentages, resource utilization rates, and ROI comparisons across departments or projects. These metrics streamline decision-making by highlighting spending patterns, identifying cost reduction opportunities, and demonstrating value creation, with many organizations finding that visual dashboards ultimately enhance financial transparency and accelerate strategic resource allocation.
Companies can leverage presentation templates to communicate cost efficiency strategies through standardized financial dashboards, before-and-after comparison slides, ROI calculators, and implementation timeline visuals. These templates streamline complex financial data into digestible formats, enabling leadership teams to present budget reductions, operational savings, and strategic resource allocation with clarity and consistency, ultimately building stakeholder confidence in cost optimization initiatives.
Technology streamlines operations by automating repetitive tasks, optimizing resource allocation, reducing manual errors, and enabling data-driven decision making across organizational processes. Through AI-powered analytics and cloud solutions, companies achieve significant cost reductions in areas like inventory management, customer service, and administrative functions, ultimately delivering enhanced operational efficiency and competitive advantage.
Businesses can benchmark cost efficiency through presentation tools by visualizing comparative metrics dashboards, competitor analysis frameworks, industry standard comparisons, and performance gap assessments. These tools enable organizations to present financial data transparently, identify operational inefficiencies, and communicate strategic improvements to stakeholders, ultimately delivering actionable insights that drive competitive advantage and informed decision-making across departments.
Common pitfalls in presenting cost efficiency data include overwhelming audiences with excessive metrics, lacking clear baselines for comparison, ignoring implementation costs, and failing to contextualize savings within broader business outcomes. These challenges can be avoided by streamlining data visualization, establishing transparent benchmarks, and presenting comprehensive ROI analyses that demonstrate both immediate savings and long-term strategic value.
Companies measure ROI from cost efficiency initiatives by comparing cost savings achieved against implementation investments, tracking key metrics like reduced operational expenses, improved productivity ratios, and resource optimization percentages. Through comprehensive financial analysis, organizations in manufacturing, healthcare, and retail sectors quantify benefits like streamlined processes, automated workflows, and eliminated redundancies, ultimately delivering measurable competitive advantage and enhanced profitability.
Charts showing before-and-after cost comparisons, infographics highlighting percentage savings, and visual breakdowns of cost reduction strategies prove most persuasive in cost efficiency presentations. These elements work by transforming abstract financial data into compelling narratives, with many organizations finding that combining pie charts, trend lines, and ROI calculators creates immediate stakeholder buy-in and accelerates decision-making processes.
Presentation templates facilitate better cost efficiency decision-making by standardizing data visualization formats, enabling consistent financial comparisons, and streamlining the analysis process across departments. These structured frameworks help organizations quickly identify cost reduction opportunities, compare budget allocations effectively, and present compelling business cases to stakeholders, ultimately accelerating strategic decisions while minimizing preparation time and resources.
Emerging cost efficiency trends include automation-driven optimization, predictive analytics for resource planning, sustainable operations integration, remote work infrastructure scaling, and AI-powered expense management systems. These approaches streamline operational overhead by reducing manual processes, anticipating resource needs, and minimizing waste across departments, with organizations finding that strategic automation delivers measurable cost reductions while enhancing productivity.
Historical cost efficiency data becomes compelling through interactive dashboards, trend visualizations, comparative charts, before-and-after scenarios, and performance heat maps that highlight patterns and improvements. These visual storytelling approaches enable organizations to showcase ROI achievements, identify optimization opportunities, and communicate financial impact to stakeholders, with many finding that compelling data narratives drive faster decision-making and strategic resource allocation.
**INPUT**: What design principles should be followed to ensure clarity when presenting cost efficiency information? **OUTPUT**: Key design principles include clean data visualization, consistent color coding, simplified charts with clear labels, strategic white space usage, and logical information hierarchy. These approaches enhance stakeholder comprehension by minimizing cognitive load, highlighting critical cost savings metrics, and enabling faster decision-making, with many organizations finding that streamlined presentations ultimately deliver improved budget approvals and operational alignment.
Interactive presentation elements enhance understanding of cost efficiency measures by enabling real-time data manipulation, scenario modeling, and visual comparisons that make complex financial metrics more accessible. Through clickable dashboards, dynamic charts, and simulation tools, organizations can demonstrate ROI calculations, budget allocations, and efficiency improvements more effectively, ultimately helping stakeholders grasp cost-saving opportunities and strategic financial decisions with greater clarity.
-
Good research work and creative work done on every template.
-
Qualitative and comprehensive slides.
-
Informative presentations that are easily editable.