

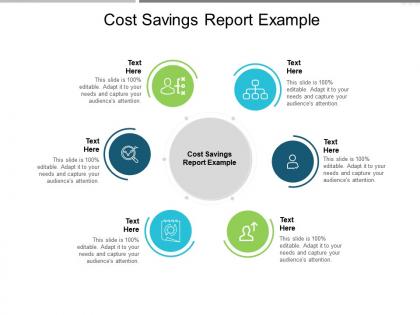
Cost savings report example ppt powerpoint presentation layouts graphics template cpb




Try Before you Buy Download Free Sample Product
 Impress Your
 Audience
 100%
100% Editable
 Save Hours
 of Time


Our Cost Savings Report Example Ppt Powerpoint Presentation Layouts Graphics Template Cpb are topically designed to provide an attractive backdrop to any subject. Use them to look like a presentation pro.
People who downloaded this PowerPoint presentation also viewed the following :
Cost savings report example ppt powerpoint presentation layouts graphics template cpb with all 2 slides:
Use our Cost Savings Report Example Ppt Powerpoint Presentation Layouts Graphics Template Cpb to effectively help you save your valuable time. They are readymade to fit into any presentation structure.
FAQs for Cost savings report example ppt powerpoint presentation layouts
Track hard savings first - that's your vendor cuts, eliminated expenses, material cost reductions. Soft savings are harder to measure but don't skip them: time saved, efficiency gains, risk stuff. Oh and implementation costs! I always mess that up initially because you get excited about the savings number, but those costs definitely eat into your net result. Break everything down by department and timeline. Year-over-year comparisons help too. The real trick is proving your savings will actually stick around long-term. Start simple with these basics, then add whatever metrics your leadership team obsesses over.
Dude, those cost savings templates are actually pretty clutch. You can track what you thought you'd spend vs what actually happened across all your projects. Most PMs I know just guess at budgets honestly - drives me crazy. But when you document everything, you start seeing patterns. Like where you always save money or where things go over budget. The historical data becomes super valuable for estimating similar projects later. I'd start using them on whatever you're working on now so you'll have decent baseline data by next quarter.
Honestly, templates are a lifesaver. Your whole team instantly knows where everything goes and what format to use. No more hunting around for info or explaining the same setup over and over. When someone new jumps on a project, they get it right away - which is clutch. The best part? Those annoying "which version are we looking at?" emails just disappear. I swear by them now. Try it on your next quarterly thing and you'll wonder why you waited so long to start using one.
Honestly, bar charts and waterfall charts are your best bet here. They make the cost savings pop immediately. Use red for costs, green for savings - sounds basic but it works. Executives' eyes glaze over with spreadsheet data, trust me on that one. Before/after comparisons hit different too, especially with trend lines showing progress over time. Keep slides clean though, like 3-4 key metrics max. I'd start with your biggest wins upfront, then get into the weeds if they start asking questions. Tables are fine as backup but don't lead with them.
First figure out what cost categories actually matter in your industry. Manufacturing? Focus on production efficiency and waste. Healthcare tends to track patient care costs and compliance stuff. Most templates are pretty flexible once you mess around with them. Customize the KPIs and benchmarks to match what your leadership team actually uses when making decisions. Also tweak the reporting frequency based on your audience - some people love detailed spreadsheets, others just want clean dashboards. Honestly, just grab a basic template and improve it after your first few reports based on feedback. Way easier than overthinking it upfront.
Honestly, the worst mistake is making it too vague for your specific situation. Break down savings by category and timeline - don't just throw everything into one bucket. Leadership gets pissed about surprise costs later, so definitely add an implementation section upfront. I've seen so many templates that skip the "how we got these numbers" part, which makes you look sketchy during reviews. Oh, and mark your confidence levels too - stakeholders need to know what's actually realistic vs wishful thinking. Trust me, when you're scrambling before that board meeting, you'll be grateful for a solid template.
Honestly, I'd say every 6 months if you're in a fast-moving industry. Annual reviews are the bare minimum. Think about it - your template from two years ago probably doesn't even have remote work savings or supply chain stuff that actually matters now. Financial regs change constantly, and new cost categories pop up all the time. I always tell people to set a calendar reminder because you'll forget otherwise. Quarterly check-ins help you catch trends early too. The real question is whether your current template still captures what your leadership team cares about. If not, time to switch it up.
For your cost savings report, grab your baseline spending data first - people need to see the starting point. Attach whatever methodology doc you used for calculations because someone's definitely gonna question your math (they always do). Invoices, contracts, vendor quotes - all that backup stuff validates your numbers. Oh and don't forget assumptions or disclaimers since there's always some weird caveat. Honestly, I'd make a quick summary sheet listing what each document proves. Makes it less overwhelming for everyone trying to dig through everything.
Honestly, just connecting your template to whatever systems you're already using will save you tons of time. I'm talking like 70% faster report generation once you automate the data pulls from your ERP. The real game-changer is setting up those recurring reports - they just generate themselves monthly without you touching anything. Real-time dashboards are clutch too since you won't be manually updating numbers every five minutes when people want updates (ugh, the worst). Start by figuring out which data sources you hit up most and check if they've got API integrations. Makes the whole process way less painful.
Dude, storytelling is everything when you're pitching cost savings to people who hate numbers. Don't just say "we saved $50K on software licenses" - that's boring as hell. Tell them how you found all these redundant tools nobody was using, fought with vendors to get better deals, then used that money for employee training instead. People actually care about problems and solutions, not spreadsheets. Frame it like a journey with real challenges. Start with something like "Here's how we turned this budget mess into an opportunity..." and suddenly everyone's paying attention. Works every time.
Honestly, templates are game-changers for this stuff. You get consistent data points to track spending patterns over months (or years if you're really organized). Quick wins that look good initially? They usually fizzle out, but your template will catch that. The real goldmine is tracking things like savings per department and ROI on those efficiency projects everyone's always pushing. I'd set up quarterly reviews - sounds boring but trust me, spotting trends early beats scrambling when budget issues blow up later. Plus comparing data is actually possible when you're not reinventing the format every time.
Start by pulling your last 12-18 months of spending data - cost per unit, vendor breakdowns, overhead ratios, all that stuff. Most people totally skip this part and then can't figure out why their budget projections are complete trash. Break your reduction targets into quarterly chunks (5-15% annually is usually realistic) so you can pivot if things go sideways. Just make sure you're adjusting for volume changes and inflation when you compare. Otherwise you're basically comparing different things entirely. The historical numbers are what'll make your template actually useful, so dig into those first.
Build different tiers - like basic, medium, and full nerd mode. Your main dashboard should just hit the big numbers in normal people language. Then add dropdown sections for the detail freaks who want everything. Charts and color-coding are your best friend here, trust me on this. Short explanations help too, maybe a little glossary at the bottom? Oh and definitely test it with people from other departments first - they'll catch the confusing parts you're blind to. Nothing worse than thinking you nailed it only to watch someone stare at your template like it's written in hieroglyphics.
Honestly, just start with a basic rating system - have people score clarity and usefulness. Comment boxes work great too because everyone's got opinions when you ask! I'd track which sections get the most pushback since that's usually where things are confusing. Quarterly reviews with your finance team are solid for bigger picture stuff. Oh, and don't go crazy collecting feedback from day one - pick like two methods max or you'll drown in data. The goal is keeping your template actually useful, not turning feedback into another full-time job.
Basically, regulatory stuff controls what sections you need and how detailed everything has to be. Healthcare and finance? You're looking at way more compliance tracking and audit trails baked into your template. Some industries want specific cost categories or approval workflows - honestly such a pain but you can't skip it. Certain data points need standardized formatting for regulatory reporting too. Oh, and definitely loop in your compliance team early to figure out the mandatory fields. Build around those requirements first, then add your other stuff. Trust me on this one.
No Reviews